It has been the best of times, it has been the worst of times…for growth and value…over the last decade.
Since the end of the Great Financial Crisis (GFC), economic and market conditions have been generally favorable for US growth stocks. The economy grew at a slow and steady pace, rates remained anchored near historic lows and inflation was benign. As a result, growth’s outperformance has been strong and especially pronounced in the last 12 to 18 months. However, conditions are gradually changing, and the extreme divergence in style performance may be waning. While it is impossible to predict the future, a look at the performance of the growth and value styles and the prevailing economic environment could offer valuable insights into what’s ahead. We delve into this issue in a 3-part post. Part 1 looked at the disparity between value and growth, Part 2 examined the reasons behind it, and now Part 3 discusses why things could change.
Part 3: Why the Divergence in the Performance of Value and Growth can Narrow
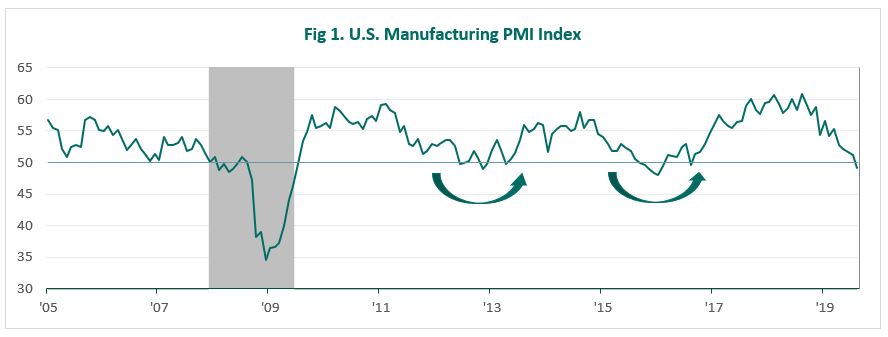
Yields have fallen precipitously since 2018 on weaker economics, driving Momentum stock leadership, and the underperformance of Value and more-shorted names. These trends reversed in September on positive macro headlines and a pickup in yields. This was one of the largest rotations in over 30 years triggered by a combination of better than expected economic data, monetary and fiscal stimulus, easing trade tensions, stabilization in yields when factor positioning (long growth versus short value) was at an extreme. While the escalating trade war has increased worries over a possible recession, renewed easing by the Federal Reserve and other global central banks has been a counterbalancing force. Despite the signs of slow growth, it does not appear that the economy is sliding into a traditional recession. In all likelihood we are experiencing the downturn phase of a mini-cycle – a period of slower growth but not outright GDP decline (see Fig. 1). In that scenario, there is a high likelihood that the performance of the two styles will experience mean reversion and normalize.

Note: Shaded area denotes recession
Source: Federal Reserve, NBER, Bloomberg, Piedmont Investment Advisors
There are a number of reasons supporting the idea that we are going through a mini-cycle and that a true recession is more likely to happen 18 to 24 months down the road –
Actions of the Federal Reserve – The critical difference between a mid-cycle slowdown and a slowdown that ends the cycle is the Fed’s ability to inject dollar liquidity into the system. Based on recent Fed actions and pronouncements, the Fed is ready to react readily to inversion signals and ease policy more rapidly than it has done in the past to avoid an inversion driven credit crunch that can then lead to a recession. The tide could start turning for value stocks as an easier monetary policy from the Federal Reserve would give a boost to growth expectations for these names.
Manufacturing versus Non-Manufacturing PMIs – While the manufacturing PMI has shown declines in the past 4 months the non-manufacturing PMI has shown an uptick. Given that services make up almost 70% of GDP, it is highly unlikely that these trends would be seen if the economy was in recession or near-recession. U.S. GDP is predominantly non-cyclical, with the service sector expanding at the expense of more economically-sensitive manufacturing. This naturally lowers overall economic volatility and increases the distance between recessions. The small weight of manufacturing in the economy also means that it must contract viciously to precipitate a broad-based recession. As the capacity utilization chart below shows, the industrial sector experienced a contraction in 2015 that was insufficient to cause an outright decline in GDP. A similar situation appears to be playing out today.

Note: Services include wholesale and retail transport, and government, financial, professional, and personal services such as education, health care, and real estate services.
Source: BEA, Credit Suisse, Piedmont Investment Advisors
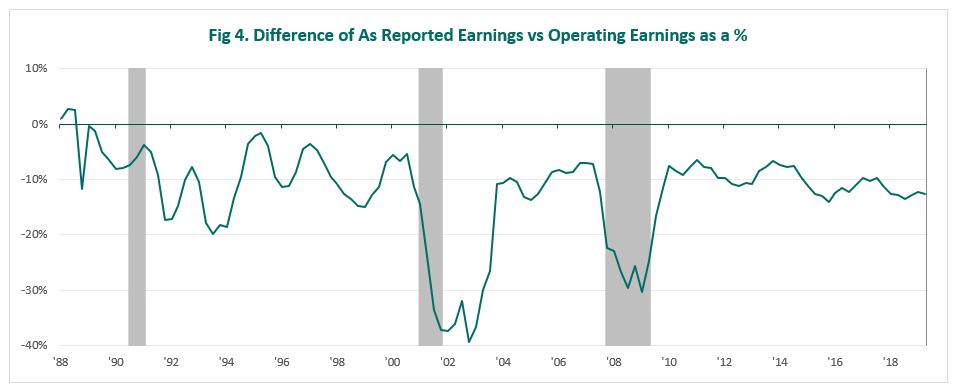
Revenues and Earnings – Corporate revenue growth and EPS growth have declined but still continue to remain at healthy levels. Consensus estimates point to expanding EPS in each quarter of 2019. The spread between GAAP and pro-forma profits widens going into a downturn, as companies deploy write-downs and other one-time items as a means to boost perceived profits. As the exhibit below shows, this is not the case at the current time.

Note: S&P 500 index, Trailing 4Q basis; Shaded area denotes recession
Source: Standard & Poor’s, Piedmont Investment Advisors
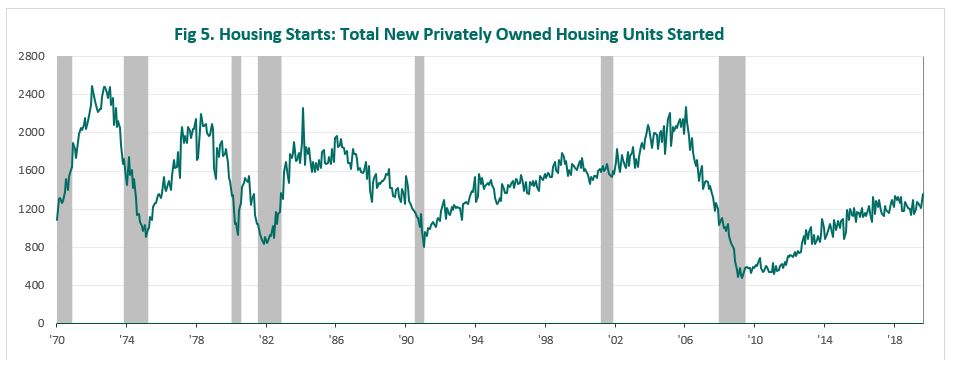
Housing – The housing sector typically experiences dislocation and stress during recessions. For example, housing activity (volumes not prices) has rolled over in each recession over the past 50 years, save the 70-71 and 2002 downturns. Again, there are no serious signs of stress and strain in this part of the economy.

Note: Unit in 000s; Shaded area denotes recession
Source: Federal Reserve, Piedmont Investment Advisors
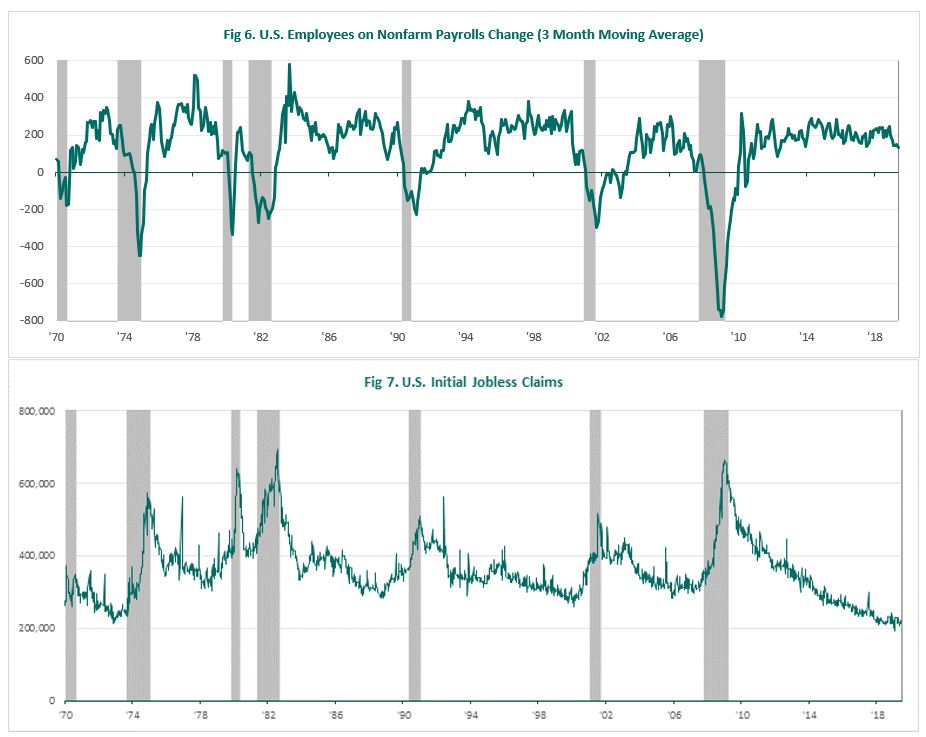
Job Creation – Job creation (Fig. 6, Non-Farm Payrolls) tends to fall apart going into a recession. On the flip side, the number of layoffs (Fig. 7, Initial Jobless Claims) tends to increase dramatically at the same time. Both of these measures look quite healthy today.

Note: Shaded area denotes recession
Source: Bloomberg, U.S. Employment and Training Administration, FRED, Piedmont Investment Advisors
Geopolitical Considerations – China has started to ease credit conditions in response to U.S. tariffs and the slowdown in growth and this could act as a stimulus. The elevated geopolitical risks in the Middle East may incentivize both China and the US to reach a timely trade agreement.
In conclusion, looking at a broad array of indicators, there are signs of a slowdown, but it does not appear that a recession is imminent. In the near term, if a trade agreement between China and the U.S. is reached and the Fed continues to stimulate the economy, there is a strong likelihood that the economy may gain steam. In that environment, the performance of value stocks can improve and the divergence between the two styles may narrow.
Source Material providers for this post include FIS Group, Credit Suisse, Loomis Sayles, J.P. Morgan, and RBC Capital Markets

