As risk-on traders take a victory lap amid surging equity markets and now renewed monetary policy accommodation, the expectations for a soft landing in the U.S. economy now form the base case scenario for a preponderance of U.S. investors. We remain more cautious, seeing growing cracks in the economic foundations of the U.S. economy, especially in the labor market. Of most imminent concern is the diminished demand for labor (see Chart 1), which is also evidenced in rising part-time workers who would prefer to work full-time, the Sahm rule, and increases in the portions of the unemployment rate due to raw job losses. Such fast-moving changes in labor demand are well-covered by several economic analysts. Less discussed, but also concerning, is what has heretofore been an absolute strength of the U.S. economy, an unexpected surge in high quality labor supply. This strength has the potential to quickly turn to a weakness that brings forward a long period of stagflationary wage pressures in the U.S.
As we discussed in our January 2022 outlook, the U.S. emerged from the pandemic with a supply deficit of 3.5 million workers, of which the combination of early retirements and increased mortality would prove long-lasting. Thus, the only way to arrest the gap would need to come from a precipitous drop in labor demand or a material loosening of immigration policy. Chart 1 shows that labor demand has indeed dropped meaningfully over the past 7 quarters such that the supply gap of workers now rests at less than 1 million persons (see Chart 2). However, labor supply has also increased by more than prior estimations, given the lack of any meaningful change in immigration policy over that time. Where did this new supply come from and what does it’s composition mean for the U.S. economy?
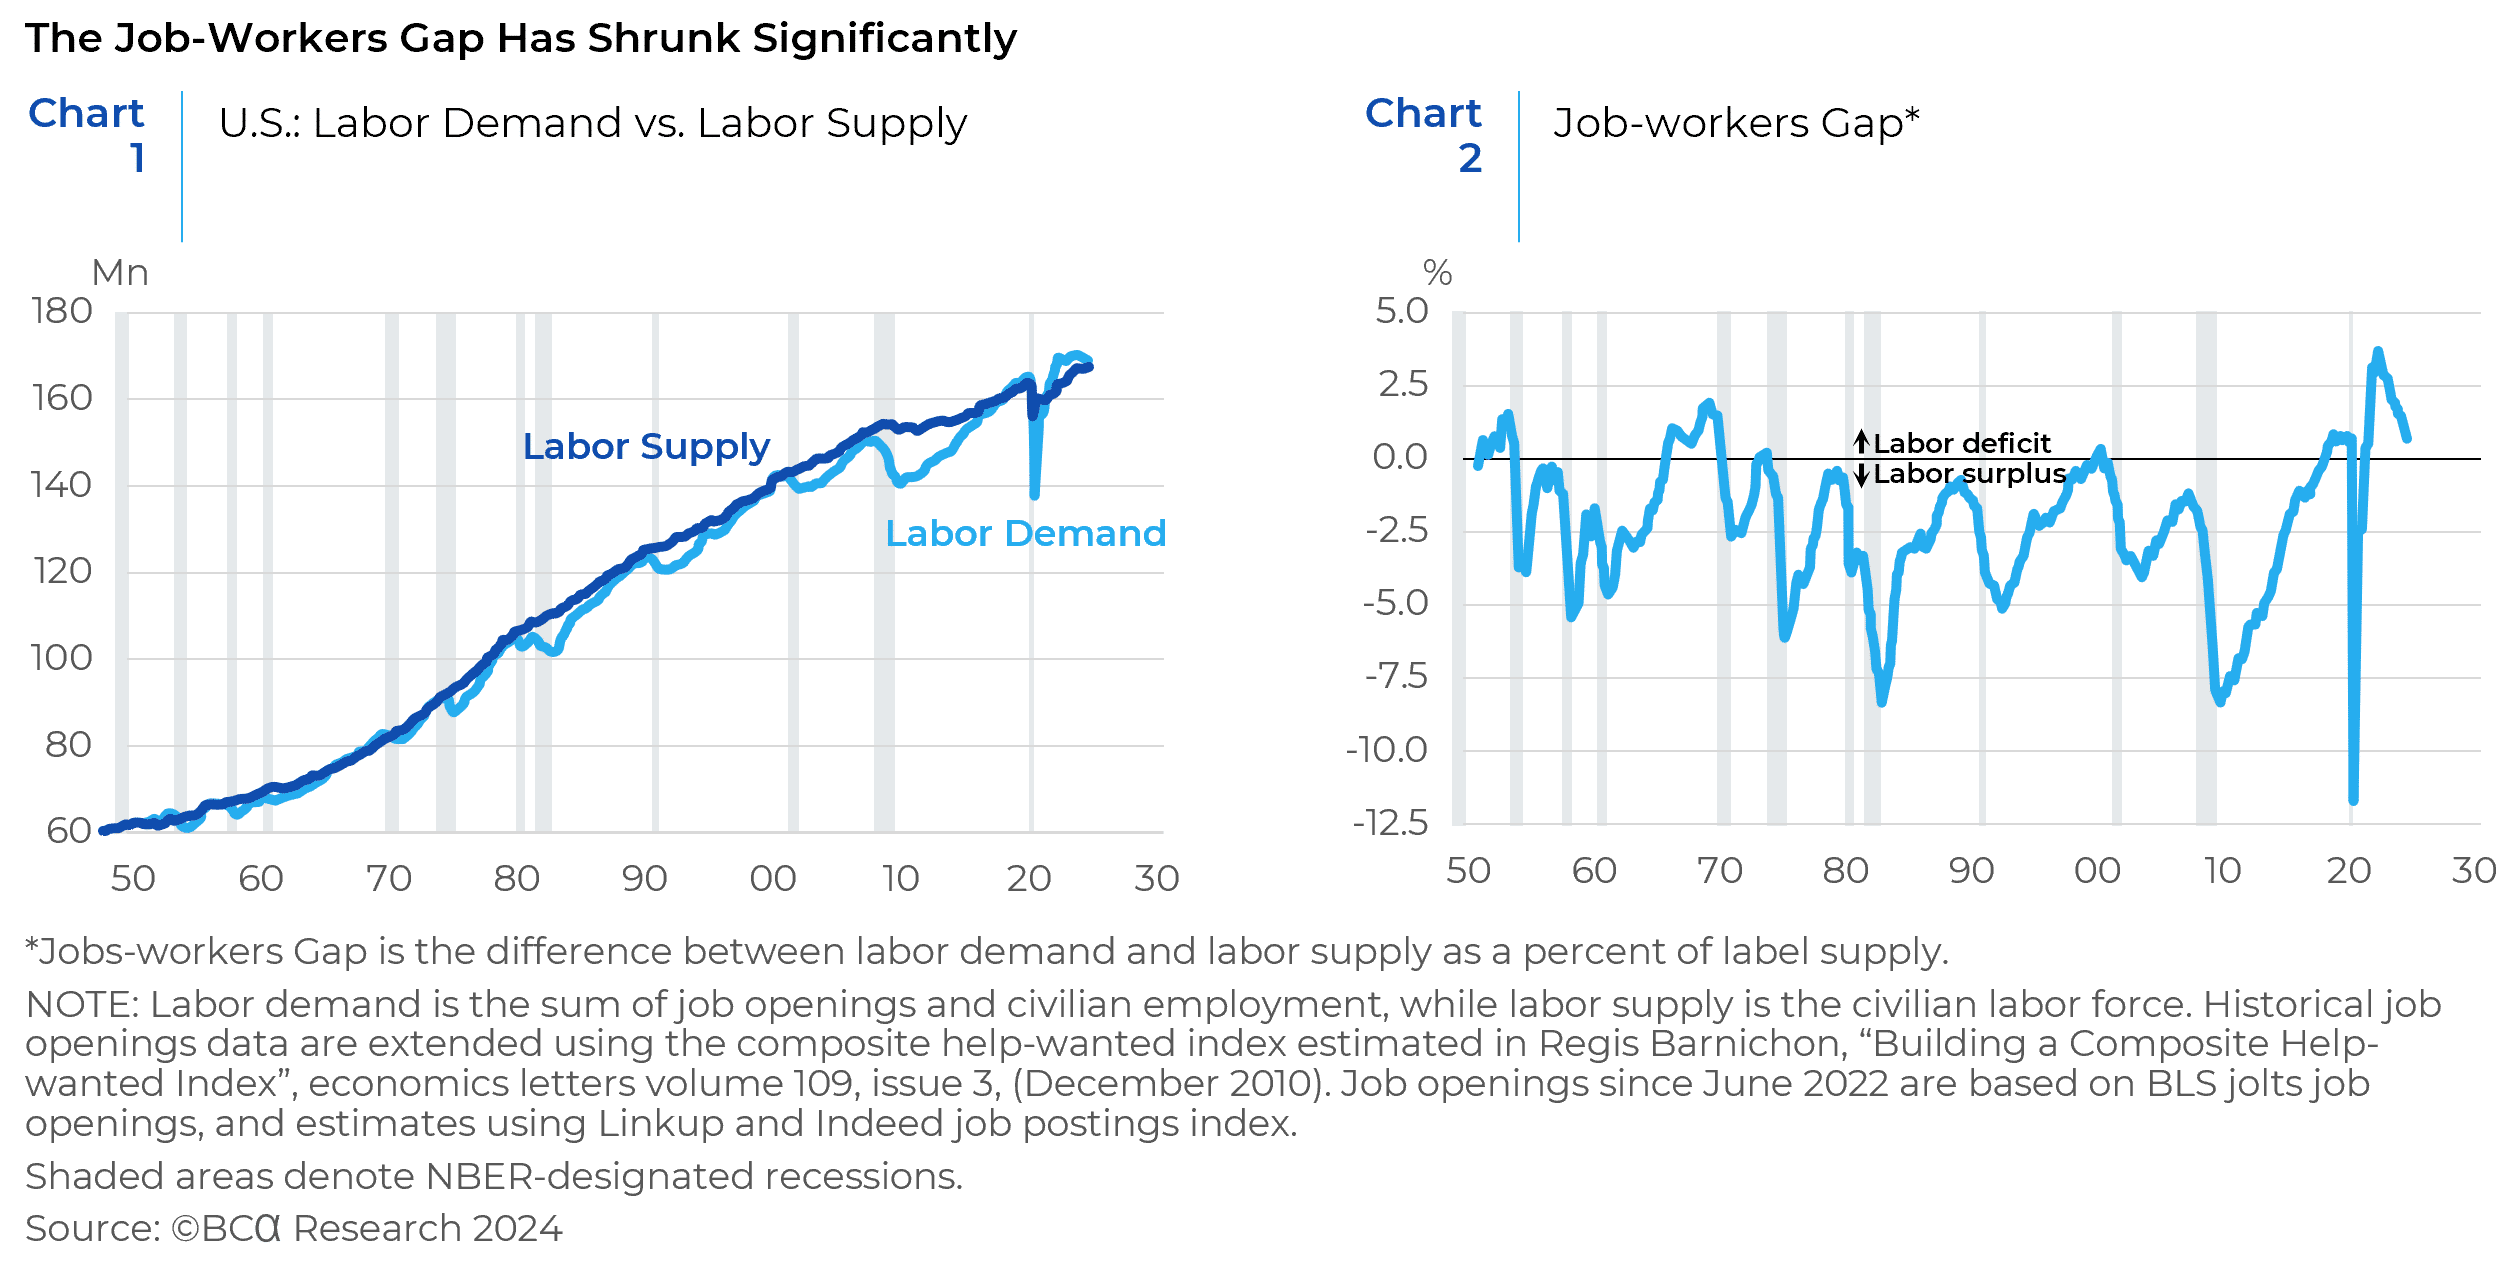
All this increase in the labor force has come from immigrants, despite the lack of policy change (see Chart 3).1 Moreover, it has come from a surge of immigration that is well above both the immediate pre-pandemic and the long-term trend growth in the foreign-born labor force (see Chart 4).
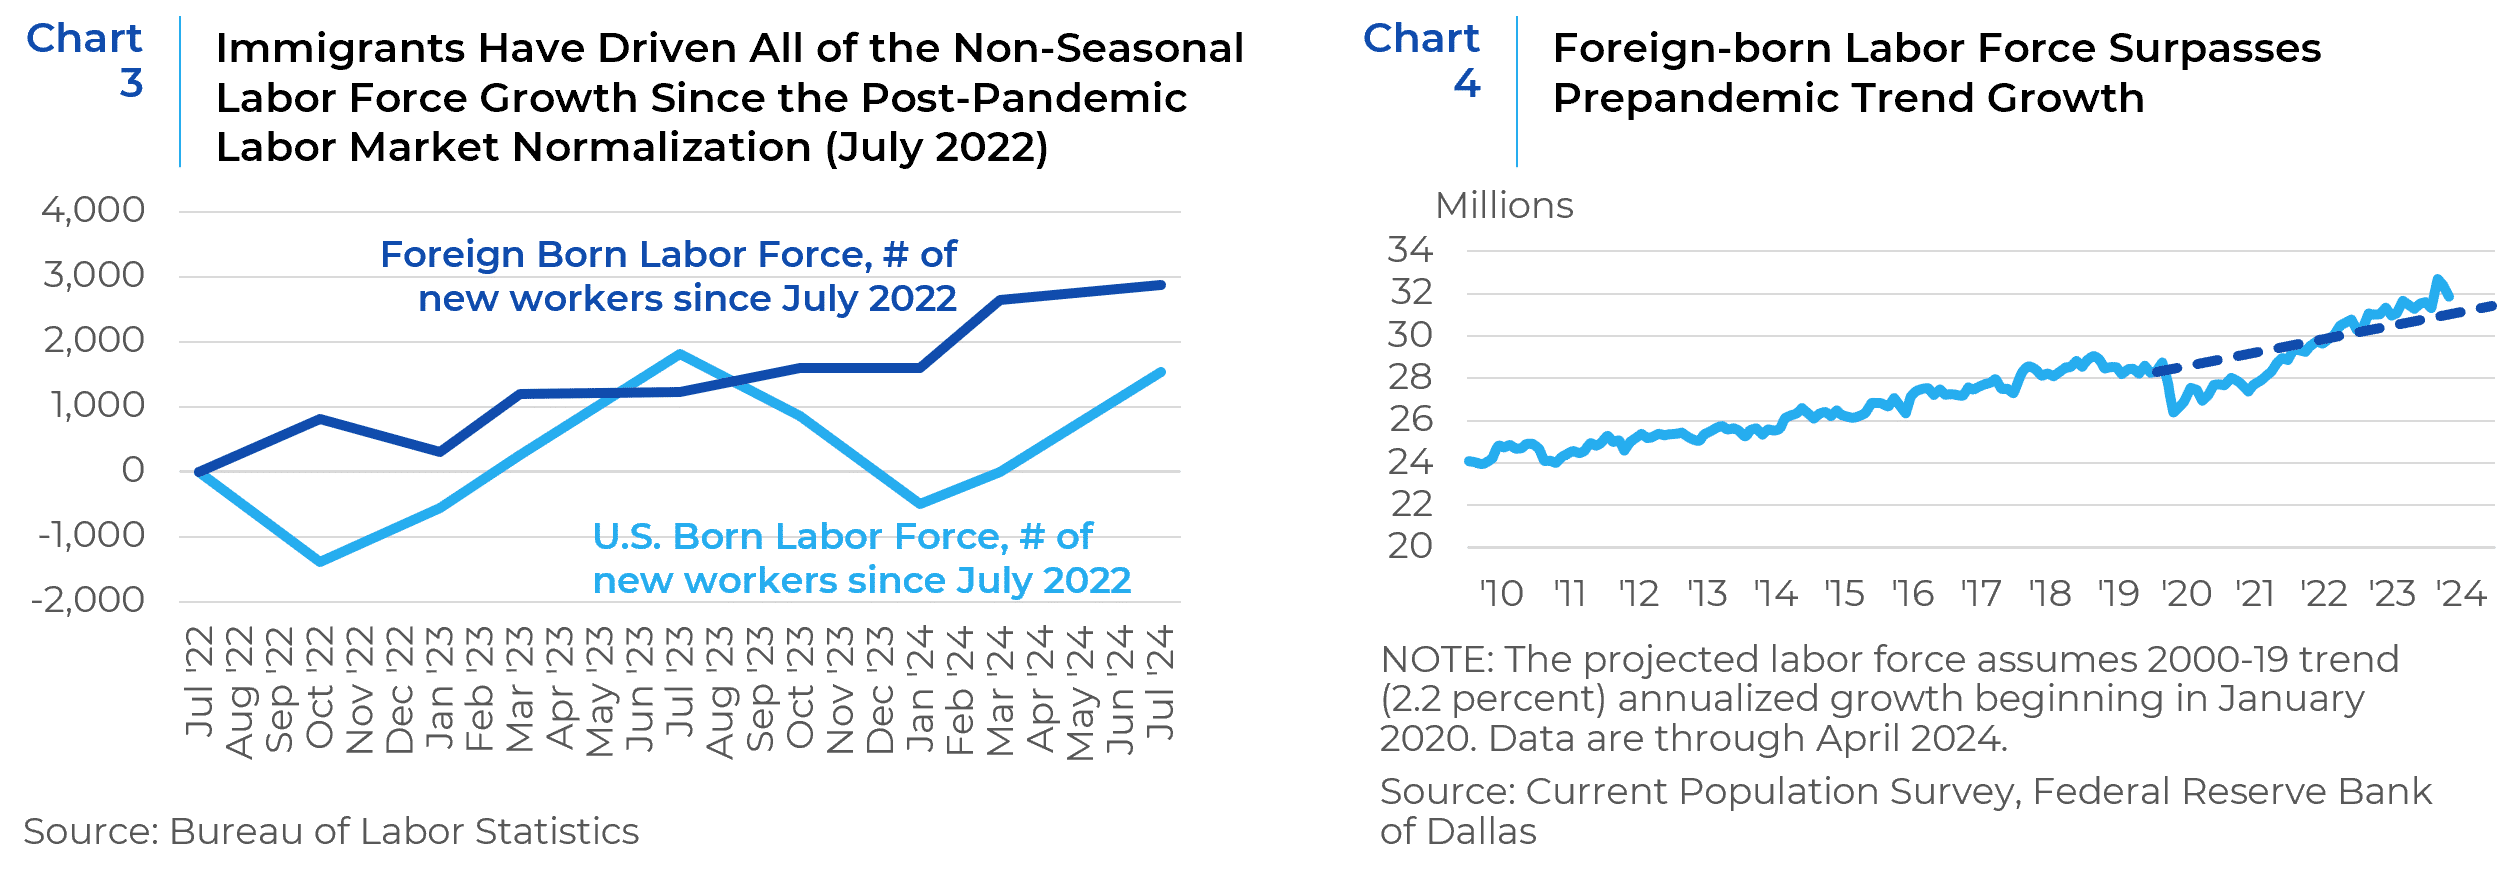
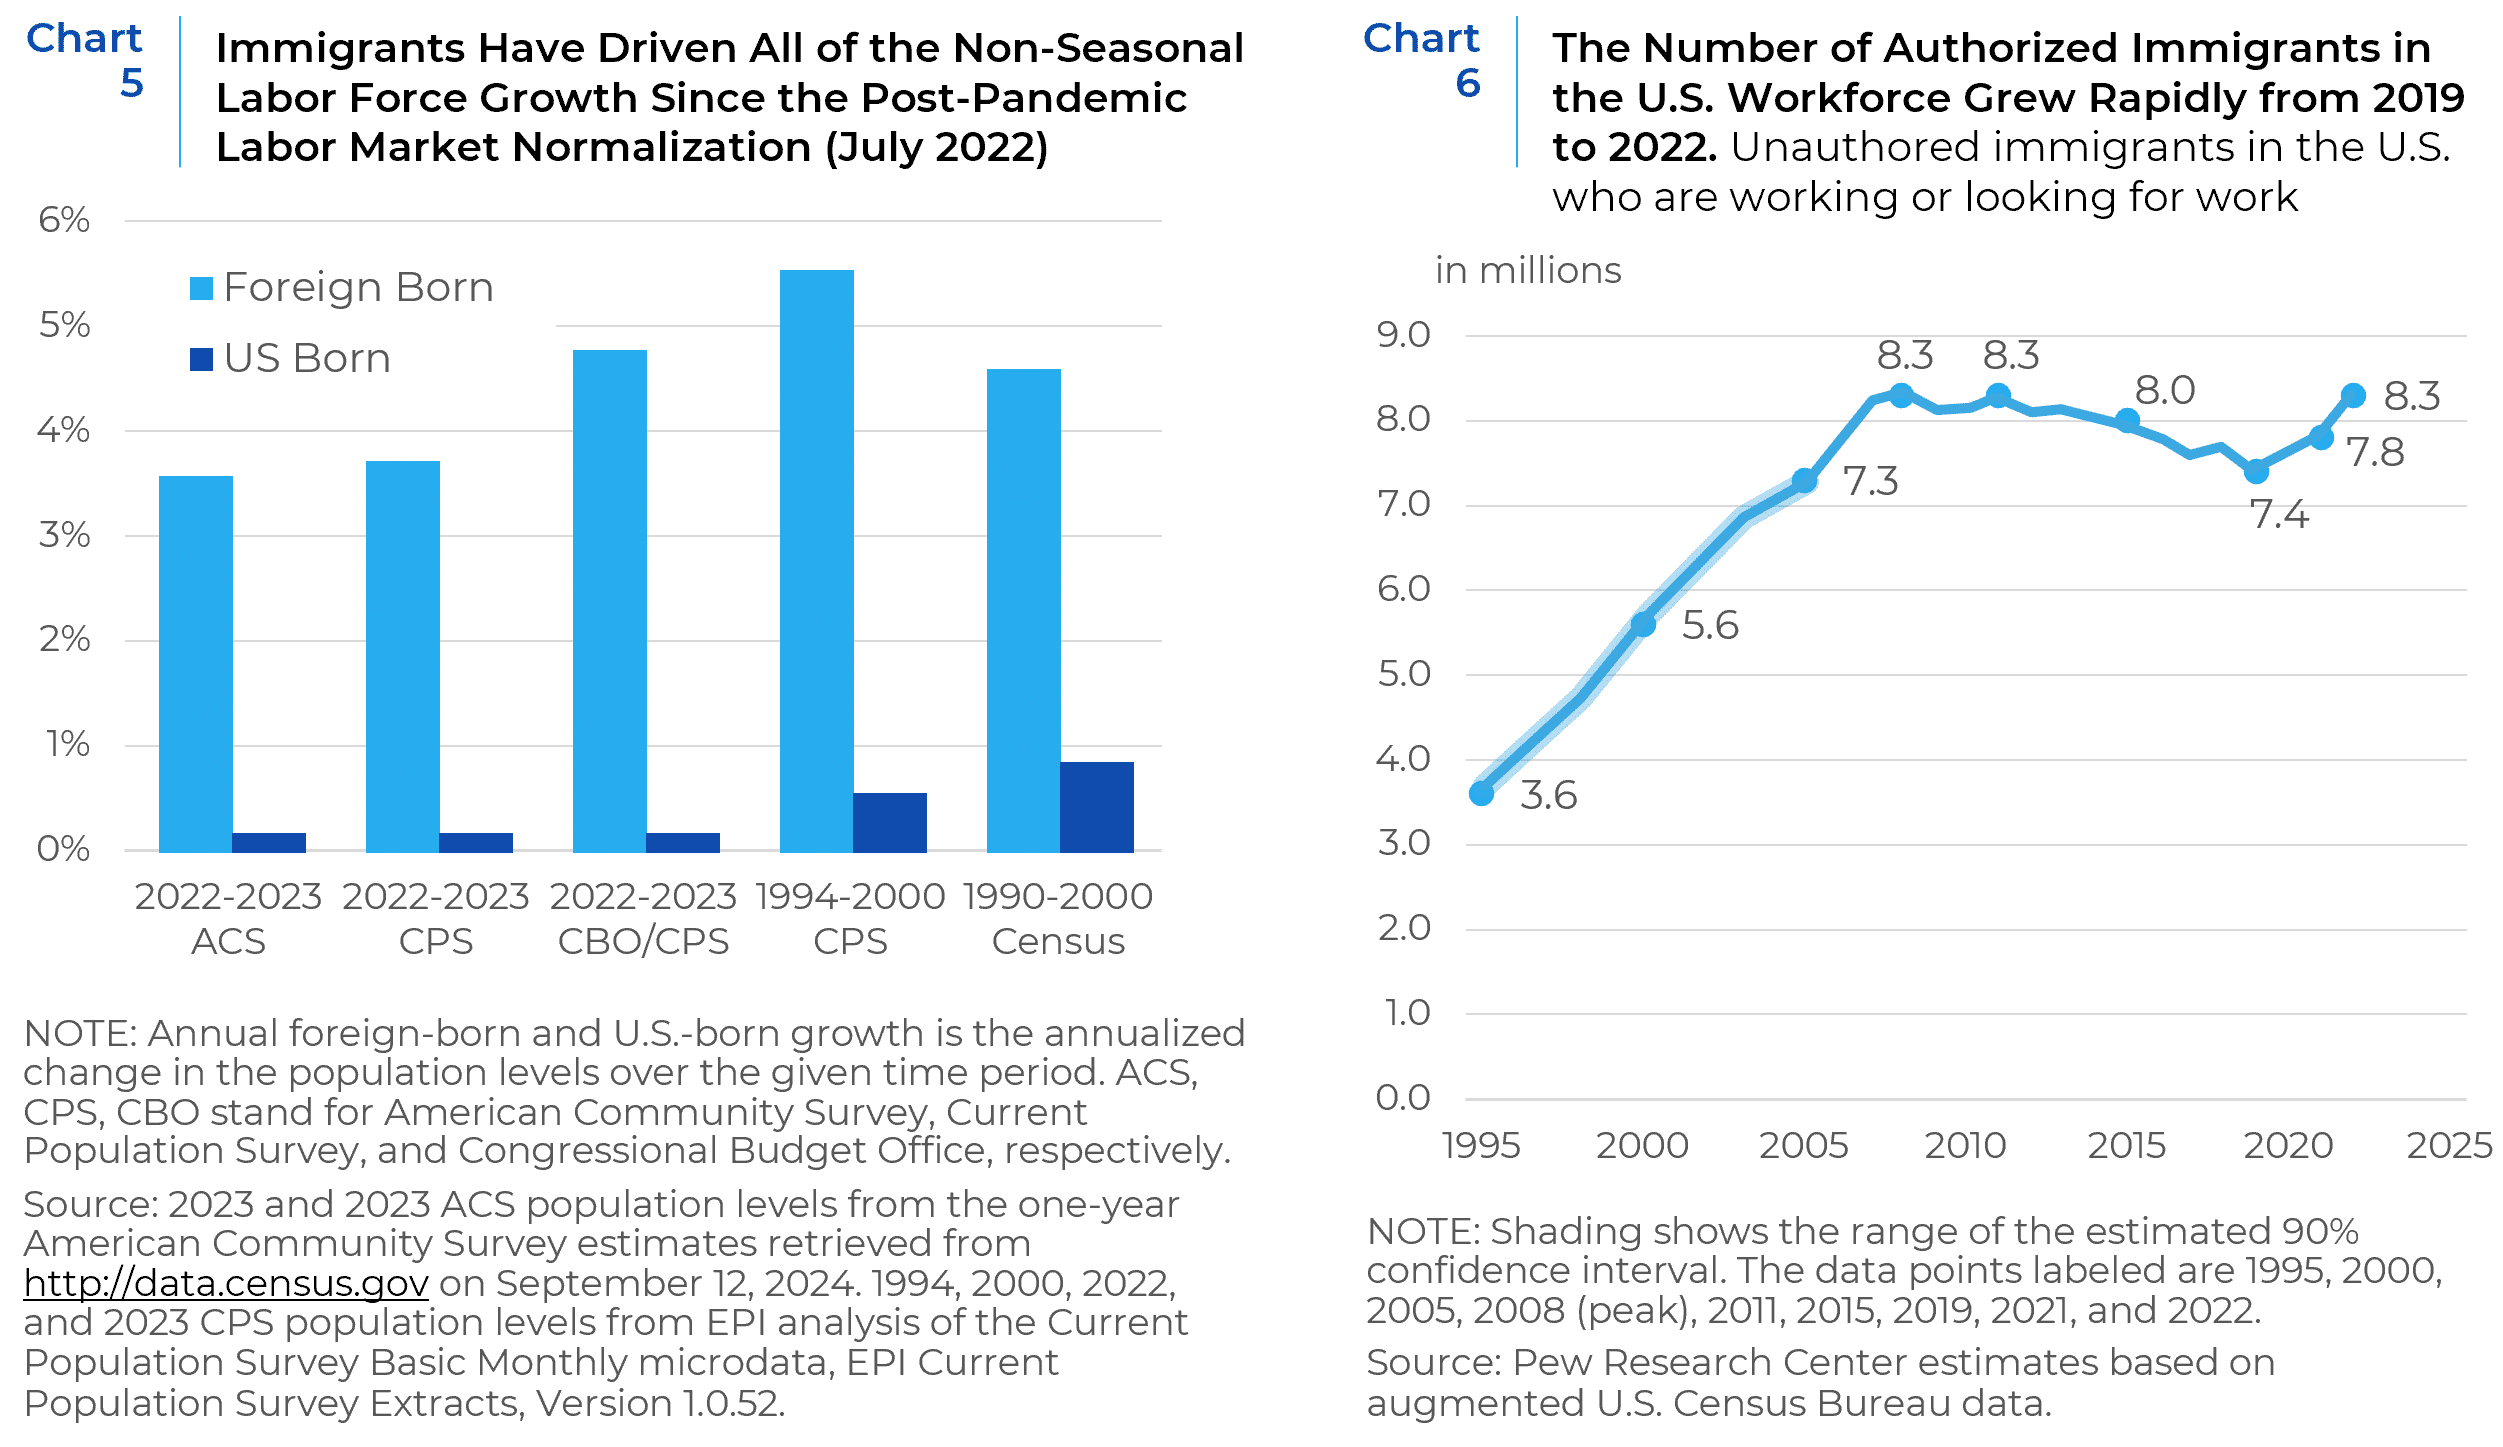
Contrary to the rhetoric of certain American politicians, this surge in net migration is not unprecedented. Data compiled through the end of 2023 by the Economic Policy Institute shows multiple estimates of annual immigration, through the end of 2023 are still below modern peaks in the 1990s (see Chart 5). The above trend increases in immigration through today may have pushed that growth rate in line with the 1990s, but by no reasonable measure is today’s immigration surge “unprecedented”.2 Further estimates by the Pew Research Center also shows that only in 2022 did the share of undocumented workers in the U.S. labor market approach the earlier highs reached prior to the GFC (see Chart 6).
Also contrary to recent political rhetoric, America’s foreign-born labor force is not primarily comprised of the “teeming masses” of uneducated refugees depicted in 30 second political adverts. The majority of America’s foreign-born labor force has some college experience and the largest cohort, by far, has a college degree (see Chart 7). Indeed, the share of the foreign-born labor force with a college degree lags its U.S.-born counterpart by only a few percentage points (41% vs 45%, respectively). Meanwhile the total population of foreign-born workers without a high school degree has been trending lower for decades and remains below its pre-pandemic levels (see Chart 8).3


As with the overall foreign-born labor force, the largest cohort of new workers is of college-educated immigrants, followed by those with a high school degree. But as Chart 7 illustrates above, that cohort was already increasing at a faster rate prior to the pandemic (4.6% vs 2.4%), so normalizing for pre-pandemic trends paints a more nuanced picture (see Chart 9). We see here that the labor market has taken in almost 1 million new entrants since the post-pandemic labor market normalization that were “unexpected” given historical trends. Roughly 80% of both the absolute number and the above trend increase in those with high school diplomas are classified by the Bureau of Labor Statistics (BLS) as Hispanic. However, the largest cohort of those with college degrees are Asian, then non-Hispanic White, Hispanic, and non-Hispanic Black (see Chart 10), with the bulk of the recent growth coming from Asia and Latin America.


That all of America’s labor force growth has been coming from immigration, is not news. Nor is it especially newsworthy that all the future labor force growth is expected to come solely from immigration, with the U.S.-born population depressing labor growth within a decade. But the increasing composition of this labor force as being college educated, is both a strength and a weakness for the U.S. economy. That the U.S. remains an attractive market to educated workers worldwide is a sign of market strength. But these highly educated workers are not without options. They could easily stop choosing to come to the United States, opting to pursue their careers in other markets or just staying home. Already, foreign-born college educated workers are employed in the U.S. only at a premium wage to their U.S.-born, college-educated counterparts (see Chart 11a). Foreign-born workers’ wages have also been closing the gap with their U.S.-born counterparts over the past twenty years (see Chart 11b) as global wage growth, especially in China and India, has outpaced the U.S.

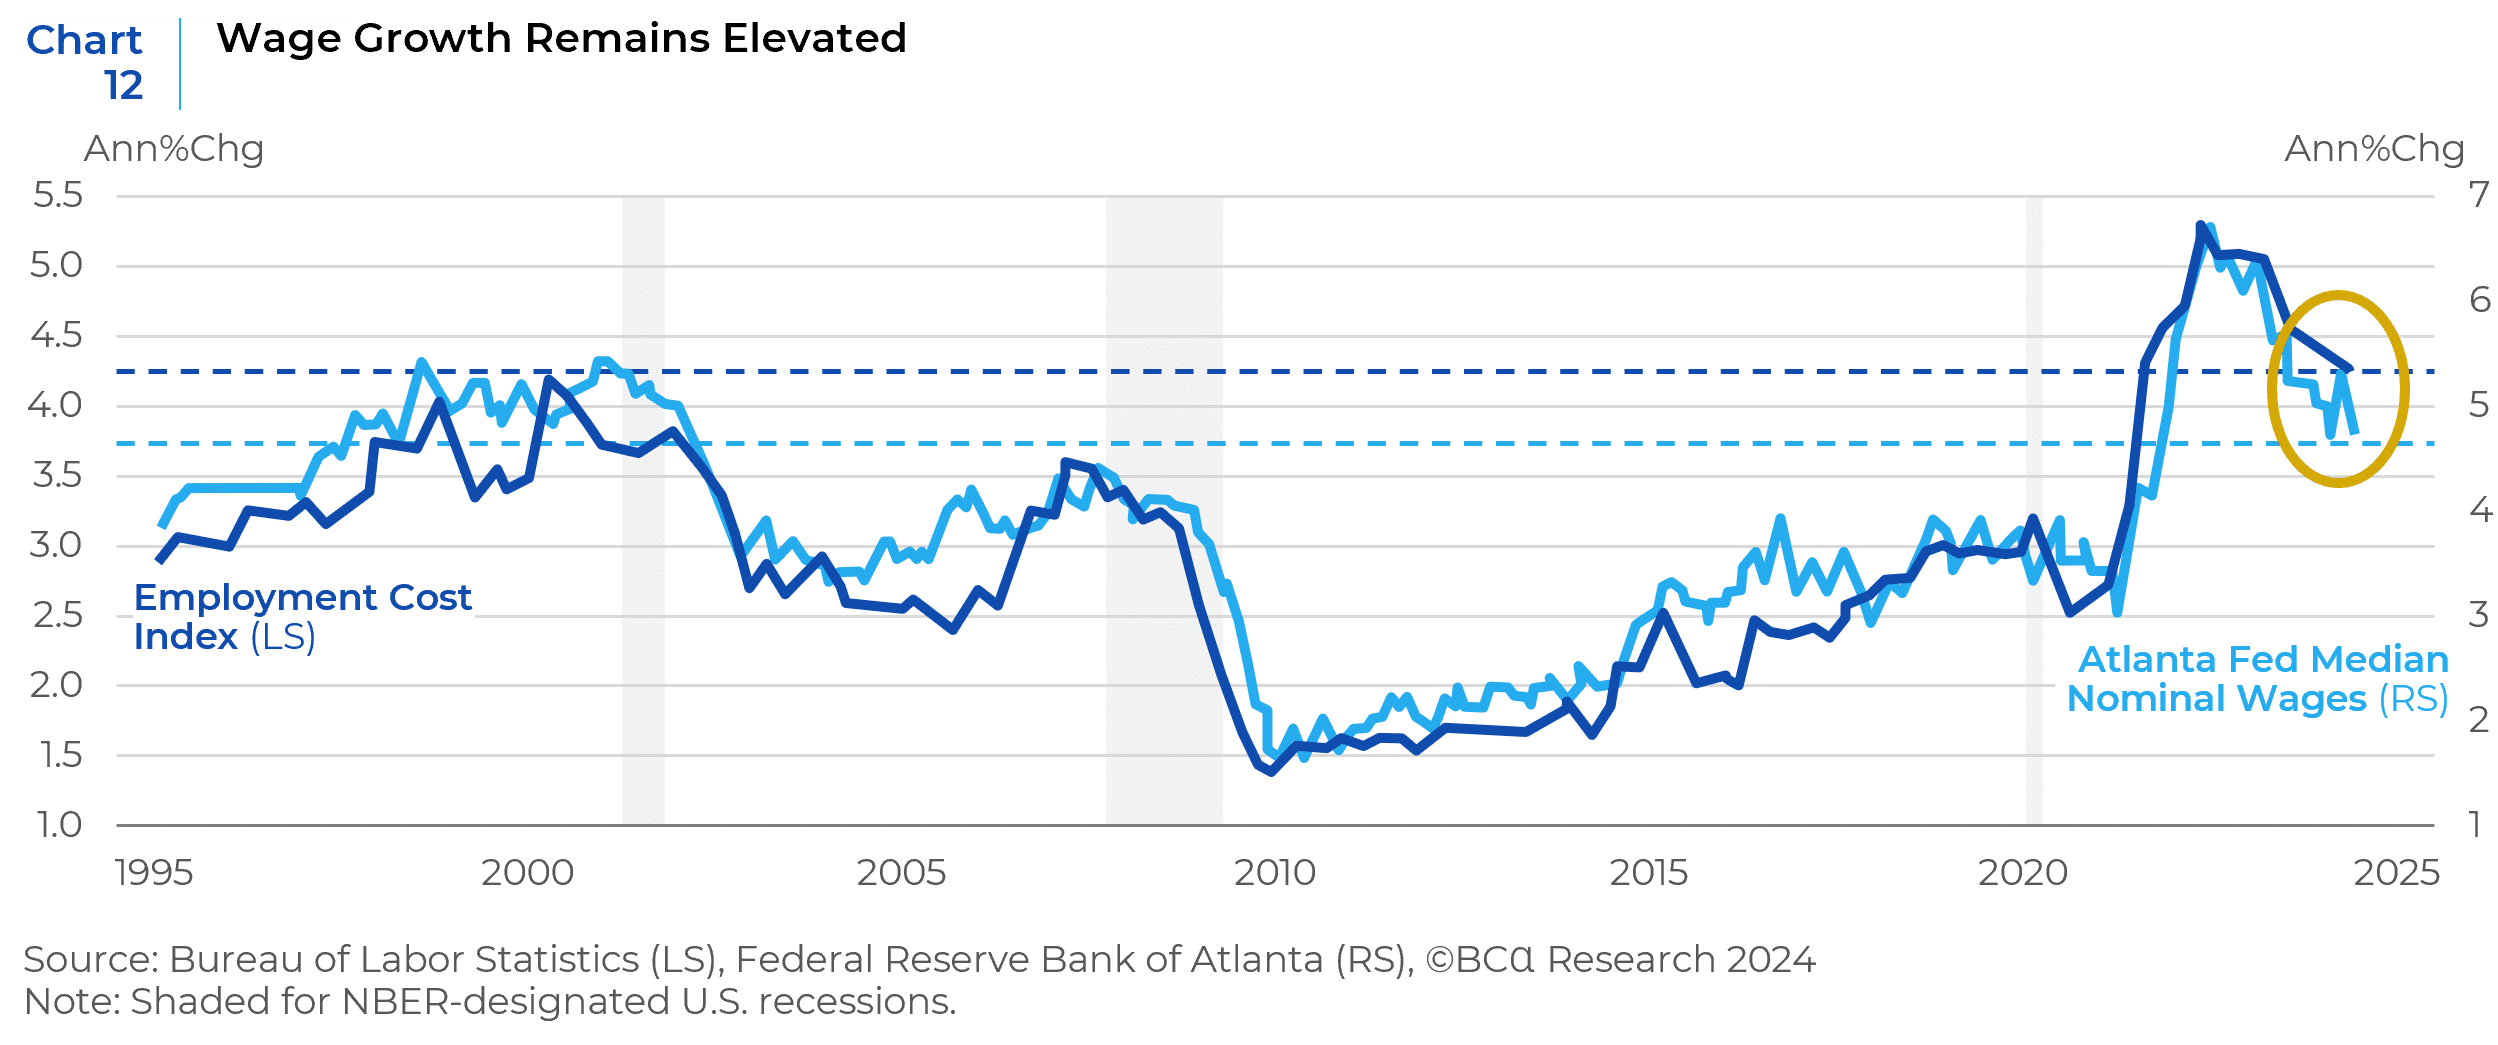
The dependency on increasingly expensive foreign-born labor for economic growth, leaves the U.S. in a potentially tight squeeze. As long as living and working in the U.S. stays in demand globally, the U.S. has the option to increase growth, but only through increasingly expensive labor. This “growth at a price” labor dynamic portends higher wage inflation, stickier overall inflation, and thus higher interest rates than what we have seen for the past decade. Indeed, the current data already confirms this story, with wage growth that is still much higher than the Fed’s CPI targets (see Chart 12).
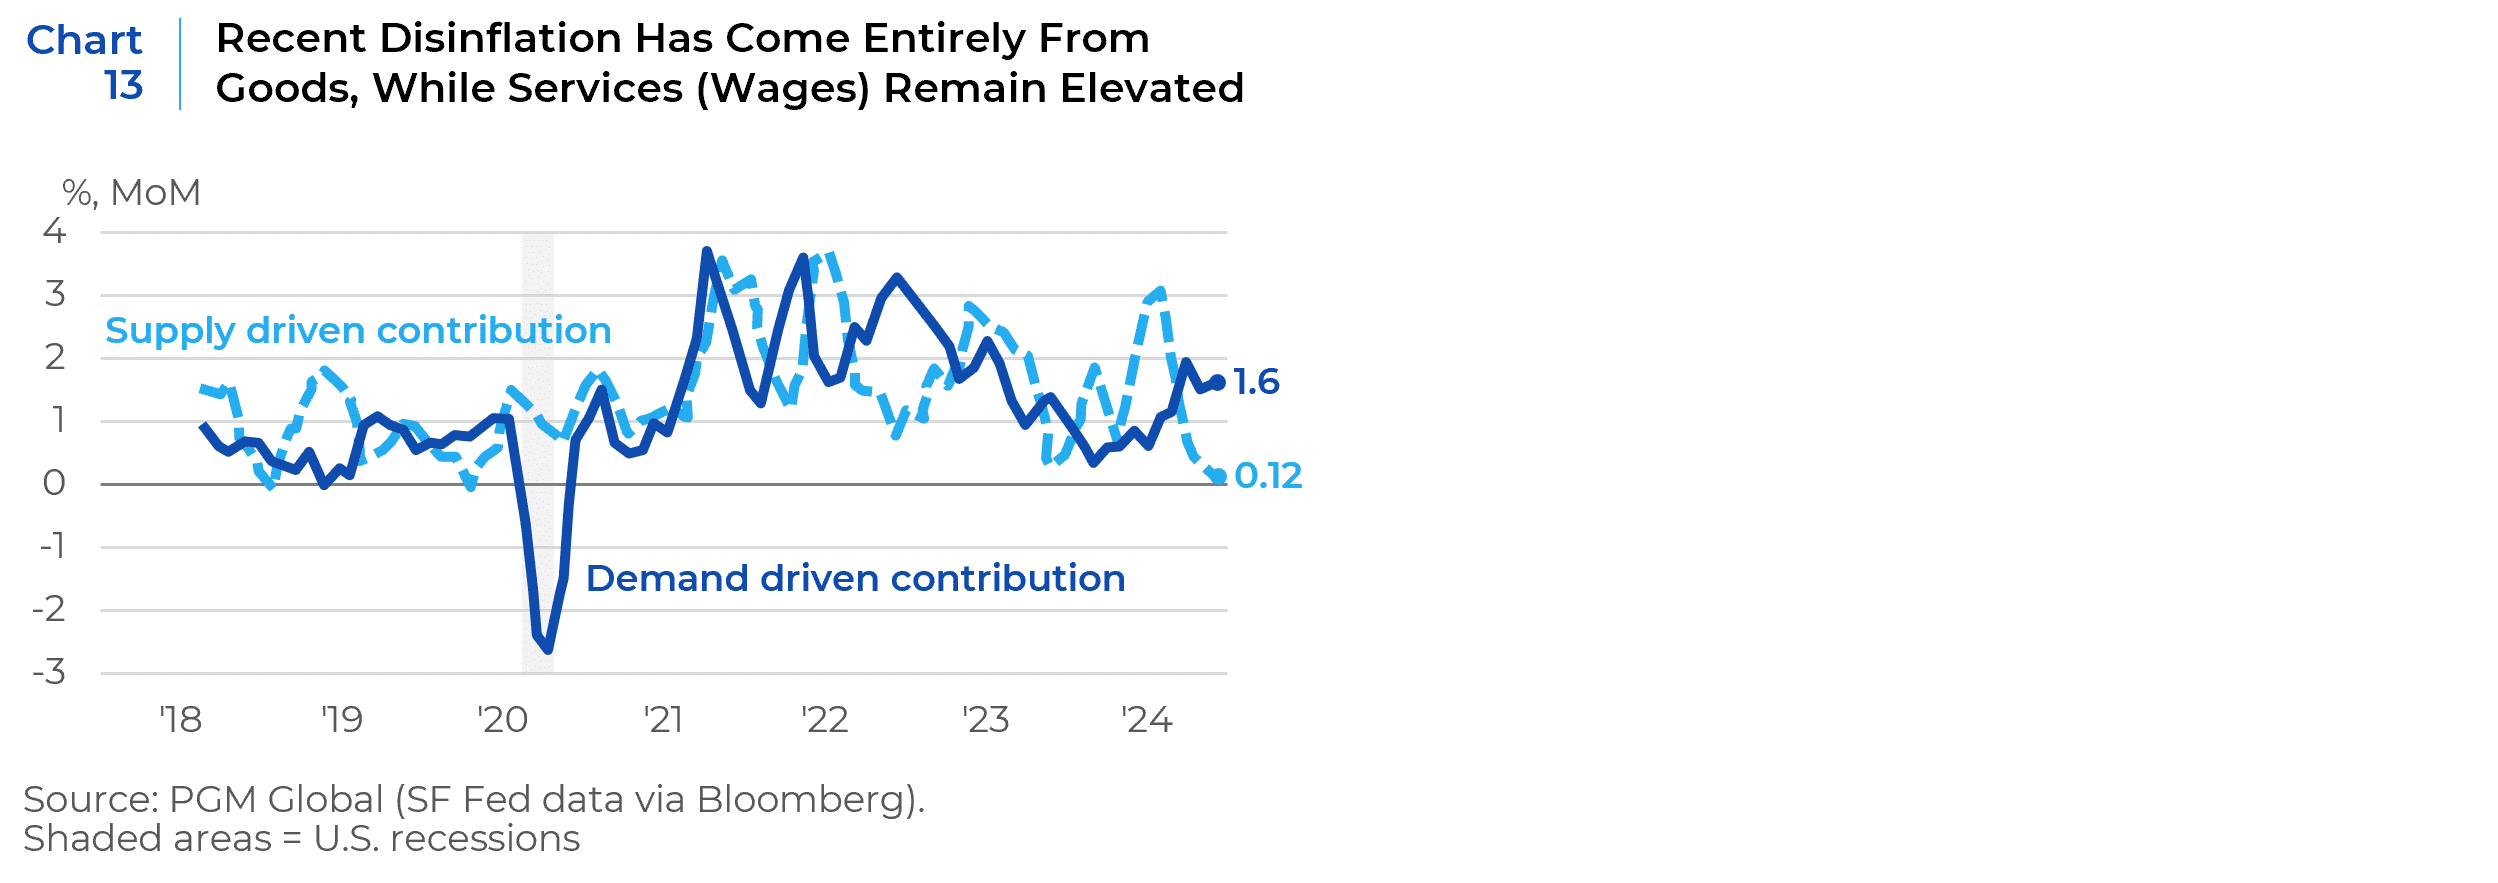
The slowdown in inflation that supported the Fed’s recent rate-cut has primarily emanated from lower goods inflation as pandemic-related supply pressures have eased. (see Chart 13).
Thus, attempts to further reduce the availability of foreign-born workers through new immigration policy would be expected both reduce economic growth, as well as increase labor costs. Should labor conditions (and wages) improve in India, China, Mexico, Venezuela, the Philippines, and Brazil (the top 6 countries of origin for college-educated immigrants from 2018-22)4 the key labor markets of college-educated immigrants, labor costs could increase further or labor availability drop. The exception to this trend would be a significant economic slowdown and demand shock. Both scenarios are not particularly bullish for U.S. risk assets, especially at current valuation levels. Sticky interest rates, and more importantly the potential for much higher interest rate policy volatility over the coming years, makes the possibility of market shocks like what we saw in 2022 more probable. For asset allocators, the implications here are to limit duration risk in their equity portfolios, adopt more flexible asset allocation policies, and increase the liquidity of their portfolios to take advantage of market volatility. For equity portfolios, we think the use of more opportunistic investment processes that stay disciplined to the potential for whipsawing valuations, could outperform their slower, low volatility-benefiting counterparts.
1 Bureau of Labor Statistics Data does not provide seasonally adjustments in their monthly releases that also include breakdowns of “foreign born” and “native born” labor force statistics, adjustments that are accounted for in the data in Charts 1 and 2. The oscillation of the “native born” labor force data in the summer months is in-line with historical seasonal oscillations and is expected to revert to near zero in the coming months.
2 Leaving aside completely prior much larger surges in immigration in the 19th and early 20th centuries.
3 The difference also does not owe to any change in the labor force participation rate, which is actually slightly higher in 2023 (57.7%) than in 2019 (57.2%). Source: Bureau of Labor Statistics.
4 Source: U.S. Census Bureau. These six countries accounted for 45% of the total of college-educated immigrants arriving in that time period, with these shares: India (19.6%), China (7.6%), Mexico (5.9%), Venezuela (4.7%), the Philippines (4.2%), Brazil (3.5%).
This report is neither an offer to sell nor a solicitation to invest in any product offered by Xponance® and should not be considered as investment advice. This report was prepared for clients and prospective clients of Xponance® and is intended to be used solely by such clients and prospective clients for educational and illustrative purposes. The information contained herein is proprietary to Xponance® and may not be duplicated or used for any purpose other than the educational purpose for which it has been provided. Any unauthorized use, duplication or disclosure of this report is strictly prohibited.
This report is based on information believed to be correct but is subject to revision. Although the information provided herein has been obtained from sources which Xponance® believes to be reliable, Xponance® does not guarantee its accuracy, and such information may be incomplete or condensed. Additional information is available from Xponance® upon request. All performance and other projections are historical and do not guarantee future performance. No assurance can be given that any particular investment objective or strategy will be achieved at a given time and actual investment results may vary over any given time.

