
Article Summary
This paper analyzes situations where momentum can be either a significant tailwind or exacerbate risks and undermine portfolio diversification. The Special Report looks at historical data and focuses on four key points:
1. Momentum’s ability to boost returns while also exacerbating crowding risk
2. The significant return disparity during the past bull market, which stems from momentum
3. How investor sentiment, measured by Bear-Bull spread and relative strength, is a poor indicator for momentum
4. Momentum’s outsized impact in the last 16 months compared to other factors such as value
View PDF Version
Synopsis – In “The Art of War”, Sun Tzu wrote: “The enemy of my enemy is my friend.” This well-known aphorism is apt when evaluating momentum investing. Whether momentum is an explicit factor or a derivative of your strategy, it can be your unintended friend or nemesis. This bifurcated outcome is particularly true when an investor is unaware of how momentum effects a specific stock price or portfolio’s total momentum.
For this research paper, we are defining momentum as price change in a security, industry, or index. At times we will use Relative Strength (the current and/or historical strength or weakness of a stock’s price relative to the S&P 500 index) as a proxy for momentum. As price trends become more pronounced momentum strategies gain more strength and accuracy, which can enhance investment performance. On the other hand, momentum can seriously undermine portfolio diversification and exacerbate its systemic risks through often under-appreciated factor exposure concentrations.
Our paper discusses the following:
- How momentum created a significant return disparity during the past bull market
- Why investor sentiment is a poor indicator for momentum
- Why momentum has had an outsized impact, compared to other factors, during the last 16 months
- Questions that institutional investors need to consider when looking at managers that use momentum in their investment process
What Is Momentum Investing and Why Should Investors Be Aware Of It?
Momentum investing is traditionally defined as an investment strategy that seeks to capitalize on pricing trends. The idea behind the strategy is that established trends are likely to continue in the same price direction. The theoretical underpinnings for momentum investing is the intersection of technical and behavioral investing. Most investors define momentum as a positive or negative trend within a stock’s price movement over a defined period. It is sometimes associated with increasing trade volume within a stock, and is usually grouped among other technical indicators. As a behavioral indicator, it can be used to identify herding (crowding). Moreover, momentum investing can often lead to confirmation biases, which occur as investors use others’ actions to confirm that their own action is right (or wrong).
Understanding momentum is just as critical as looking both ways before crossing a busy intersection for a pedestrian. Blindly entering a market based solely on one view (whether it is right or wrong) without examining the whole landscape can have an adverse effect on portfolio returns and volatility. This is because momentum strategies may result in trade crowding, whereby a significant number of market participants with large pools of capital trade in and out of stock positions in order to pursue the same, or very similar, investment strategies. A crowded position occurs when there is a significant overlap of portfolio positions and allocations as a result of crowded trades which, in total, add up to a significant share of a stock’s free-float market capitalization. Crowding reduces the future effectiveness of a given investment strategy in predicting stock returns. Depending on the extent of the friction, such as shorting constraints and transactions costs, this overlap of positions among managers may result in extreme levels of risk when those investors experience negative shocks in other parts of their portfolios, forcing them to liquidate their positions (selling what they can, rather than what they would necessarily like to). These “fire sales” may then cause losses for other investors following the same strategy and result in further liquidations, driving stock prices into a downward spiral. Crowding risk affects a wide range of so-called “unanchored” strategies, including momentum, that does not rely on a consistent or independent estimate of fundamental value. Investors tend to employ reasonable capacity assumptions in pursuing their own strategy, but they may underestimate the aggregate amount of capital following similar strategies. In this case, stock prices may over- or under-shoot their fundamental value and experience a sharp correction in subsequent periods as prices adjust to reflect fundamentals.
Crowding can also occur among market factors either as a result of highly correlated security selection or more directly, through correlated “smart beta” and/or factor-tilt strategies. As more investors concentrate on the same factors, the degree of factor crowding increases; and at extreme levels, can result in “factor crashing” and significant performances drawdowns. The “quant meltdown” which occurred during the 2007 through 2008 financial crisis is a classic example of crowded trades that led to certain factors and strategies, such as momentum investing, experiencing significant losses.
How Momentum Investing Created a Disparity of Returns over the Past Few Years
Viewed over a long-term perspective, most performance research indicates that the primary contributors to returns based on the research done by MSCI Barra were momentum and value. CHART 1, provided below, is a study conducted by MSCI Research on performance from December 1996 through December 2013, which substantiates this commonly agreed upon conclusion.
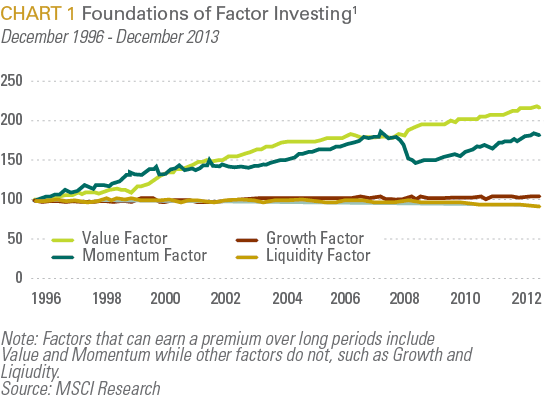
This chart echoes the thoughts of some practitioners who posit that only value or momentum factors exhibit a sustainable performance advantage.
Over the trailing six years through 9/30/2015, momentum, as defined by relative price strength, provided a significant tailwind to investment portfolios. As shown below, the top two quintiles of relative strength outperformed the growth indexes significantly, while the median and bottom quintiles underperformed US equity markets (as shown below). The only place where this was not evident is in the Midcap benchmark, where the median quintile outperformed the index. (See TABLE 1).
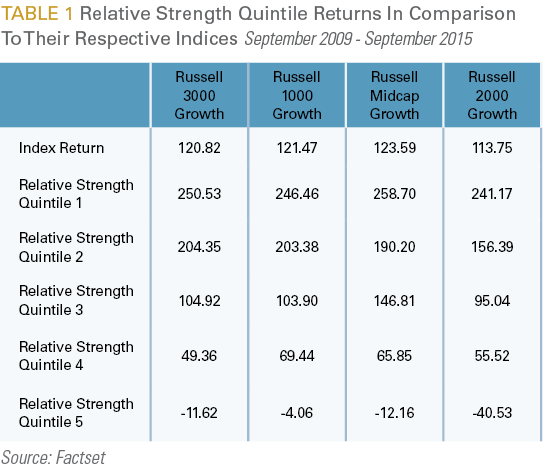
We used the growth indices because momentum investing is more often incorporated within growth strategies than value based strategies. Also, within the time period examined, growth indices were heavily influenced by the unprecedented run-up of the health care sector that was fueled by the biotech industry. Before 2015, health care outpaced the other 10 sectors over each of the past five years. During this timeframe, as FTSE and Russell did their annual index rebalancing, the biotech industry weighting crept up as a by-product of their outperformance. The biggest effect was in the smaller market cap indexes (Russell 2000 Growth and Microcap Growth), where biotech is one of the most significant industries within the index.
Investor Sentiment as a Proxy for Momentum
Many managers that we have evaluated over the years consider investor sentiment to be a partial proxy for momentum. We evaluate this relationship through the cluster analyses shown below. To isolate the momentum return, we utilized the MSCI USA Barra Momentum Index, since this index neutralizes all other factors. As a proxy for investor sentiment, we used the bull-bear four-week spread for the S&P 500 index. We then evaluated the momentum index relative to the bull-bear spread and top-bottom relative strength quintile dispersion for the S&P 500 index for the period between. As shown in the top panel of CHART 2, there was a somewhat positive but largely insignificant relationship between momentum and investor sentiment (as measured by the bull-bear spread). The bottom panel of CHART 2 shows an equally unconvincing relationship between momentum and relative strength dispersion for the Russell 3000 Index.

This lack of clustering leads us to believe that the returns of these variables are fairly independent of each other.
We also examined the two-year rolling correlations between the MSCI USA Barra Momentum Index and both the bull-bear spread and relative strength quintile spread in CHART 3 and CHART 4, respectively. This analysis suggests a time varying but inconsistent long-term relationship between momentum and both investor sentiment and relative strength.


For example, the correlations between the momentum index and the monthly bull-bear spread trended up in 2011 and 2012 before eventually plateauing. This observed increase in correlations resulted from increased market uncertainty emanating from a series of political events that were occurring both in the U.S. and in Europe. On August 5, 2011, in response to Congress’s initial resistance to expanding the nation’s debt ceiling, the S&P downgraded the United States’ long-term federal debt from AAA to AA+ causing Ten-year Treasury yields to fall as low as 2.33% in New York that same day . The underlying reasoning for the downgrade by S&P was a result of “the gulf between the political parties.” The downgrade happened in the midst of rioting in Athens, in response to austerity measures that were being imposed by the so-called “Troika” which comprised the IMF, the ECB and the European Commission. The uncertainty of 2011 continued into 2012, and was compounded by the fiscal cliff debate and a contentious U.S. presidential election. By the end of 2012, Greece was bailed out, President Obama secured a second term and the Federal Reserve extended Operation Twist along with initiating QE3 (online conspiracy theorists’ Mayan calendar hysteria thankfully proved ungrounded). Correlations increased during the first half of the year, but leveled off toward the middle of the year. During this two-and-a-half-year period, correlations moved from .1 to slightly above .6. While there is little evidence of a continuous long-term trend, the key variable which connected the short-term correlations between momentum and investor sentiment was uncertainty. CHART 3 also evaluates the relationship between momentum and investor sentiment and the index of economic uncertainty compiled by Stanford University. The chart demonstrates that the uncertainty index has a leading (or coincident) relationship with their correlation during this time period.
As with the analysis relative to investor sentiment, CHART 4 suggests there is no discernible trend between momentum and the Russell 3000 top/bottom quantile spread. The correlation between these two variables is exhibited in two periods of sharp negative reversals. The first was the 2008 credit and market meltdown and the second occurred between the end of 2011 to the middle of 2013. This latter reversal from a positive to a negative correlation relationship likely reflected the aforementioned mitigation in political uncertainty as well as the impact of market liquidity enhancing monetary policy measures by the Federal Reserve Bank during the period. Consequently, factors such as leverage, book to price, earnings yield that underperformed during 2010 (relative to high quality defensive stocks) were boosted by extraordinary monetary policy measures such as QE 2 and 3 as well as Operation Twist in 2012.
The Relationship Between Valuation and Momentum
During periods of elevated volatility, the momentum factor will tend to exacerbate the velocity and magnitude of trend reversals. A clear example of the interplay between valuation and momentum is the TMT (Technology, Media, Telecom) bubble. As is well known, the NASDAQ index (which was compromised by almost all TMT stocks) appreciated by 441% between 1995 and December 1999, peaking intraday on March 10, 2000 at 5,132.52, before drastically reversing over the course of that year until 2002. More recently, we witnessed a microcosm of this dynamic in the strong performance of biotech stocks between 2012 and 2014. As shown in CHART 5, stock prices for this sector rose by 217.7% despite an increase of 54% in earnings. While earnings rebounded somewhat in 2015, biotech stocks continued to advance by another 8%. Over the five-year period ending 12/31/2015, biotech stocks rose by 272.58% while earnings rose by 245%. Earnings were buoyed by a one-time sales growth spike of 35% in 2014, which trickled down into Operating Income growth of 97%. During this five-year period, long term debt grew 224%, while the average volume for the sector increased by 3%.

In order to obtain an in-depth understanding of what was happening over this short time frame, we decided to dig deeper into the composite. The biotech industry is bifurcated, with four firms (Amgen, Gilead, Celgene and Biogen) making up close to 50% of the index weight and most of the remaining firms classified as small cap securities (and unprofitable). Over the past five years, the top four stocks have performed as follows:

All four companies have had robust top line and bottom line growth while benefitting from share buybacks and cheap debt. All but Amgen have outperformed the index’s five year period total return of 319.57%. However, during the past two years only Amgen outperformed the industry, which was driven by the substantial increase in earnings in 2015. For the remaining top firms (Gilead, Celgene, and Biogen) YoY P/E NTM declined due to mixed earnings and substantially increased debt consumption.


As demonstrated by CHART 6 and CHART 7 above, valuations for the biotech industry were excessive in 2014, and prices continued to advance in 2015 however, we have seen sharp pullback in the market over the past 11 months. Year to date the industry is down 19.75% (as of mid-June of 2016). Based on the sample of companies utilized for this exercise and data analyzed, the biotech industry should have dropped instead of posting a total return of 43.50% over the past two years. We suspect momentum was the hidden ballast that propelled biotech stocks.
Conclusion
Momentum is a factor that can be a significant headwind or tailwind for your portfolio, so understanding what drives the factor is critical. As investors, our goal should be to sift through the noise to find what will drive the stock price higher.
When sifting through the noise we should constantly consider these questions as it relates to momentum.
- Why is the market trending in this direction
- Does this trend make sense based on current/historical valuations and if not, what is different?
- How crowded is the trade relative to historical levels?
- Is the information available transparent (or convoluted)?
- What are investors on the other side of the trend saying (or not saying)?
- Does this momentum reflect where we are within the current economic environment or business cycle?
These questions help us better understand what is truly driving momentum—in the market, sectors or stocks—and if it is sustainable. As with all factor-based approaches, we try to remain mindful of the risk behind the factor because it can have significant negative effects on returns. In the third quarter, we observed a reversal of the momentum trend which is why within our process, we remain cognizant of our momentum exposure, and as well as other factors, within our portfolios and our managers’ portfolios.
At FIS Group, we analyze our sub-managers’ investment processes and utilize our proprietary portfolio construction process to optimize fundamental factors, like momentum and value, within our strategies. Our investment process is comprised of two alpha engines, our managers’ bottom up stock selection accompanied by our top down investment strategy. While times of expanding momentum can be a tailwind for performance, we are more likely to reduce exposure to this factor when it has exceeded variance limits, because after market corrections it has a tendency to lag in these periods. Moreover, in order to reduce the risk of undue factor concentration, we recently developed a factor crowding model to systematically discern factor crowding at the overall portfolio level. In closing, we acknowledge that momentum as a factor can be additive to performance when understood by investors; however, it can also be an unintended enemy to those unaware of its effects. Our job as investment professionals is to dig deeper to understand the reasoning behind the movement in prices and whether that movement has approached unsustainable levels. Investor sentiment (as measured by the Bear-Bull spread and relative strength) alone is not sufficient for measuring positive momentum. In our view looking at a multitude of indicators, such as factor crowding, valuation, are all necessary for discerning both the negative and positive side effects from momentum.
Sources:
1. Foundations of Factor Investing, December 2013 MSCI Index Research Bender, Briand, Melas, Subramanian
2. Economic Policy Uncertainty, www.policyuncertainty.com
Important Disclosures:
This report is neither an offer to sell nor a solicitation to invest in any product offered by FIS Group, Inc. and should not be considered as investment advice. This report was prepared for clients and prospective clients of FIS Group and is intended to be used solely by such clients and prospects for educational and illustrative purposes. The information contained herein is proprietary to FIS Group and may not be duplicated or used for any purpose other than the educational purpose for which it has been provided. Any unauthorized use, duplication or disclosure of this report is strictly prohibited.
This report is based on information believed to be correct, but is subject to revision. Although the information provided herein has been obtained from sources which FIS Group believes to be reliable, FIS Group does not guarantee its accuracy, and such information may be incomplete or condensed. Additional information is available from FIS Group upon request.
All performance and other projections are historical and do not guarantee future performance. No assurance can be given that any particular investment objective or strategy will be achieved at a given time and actual investment results may vary over any given time.