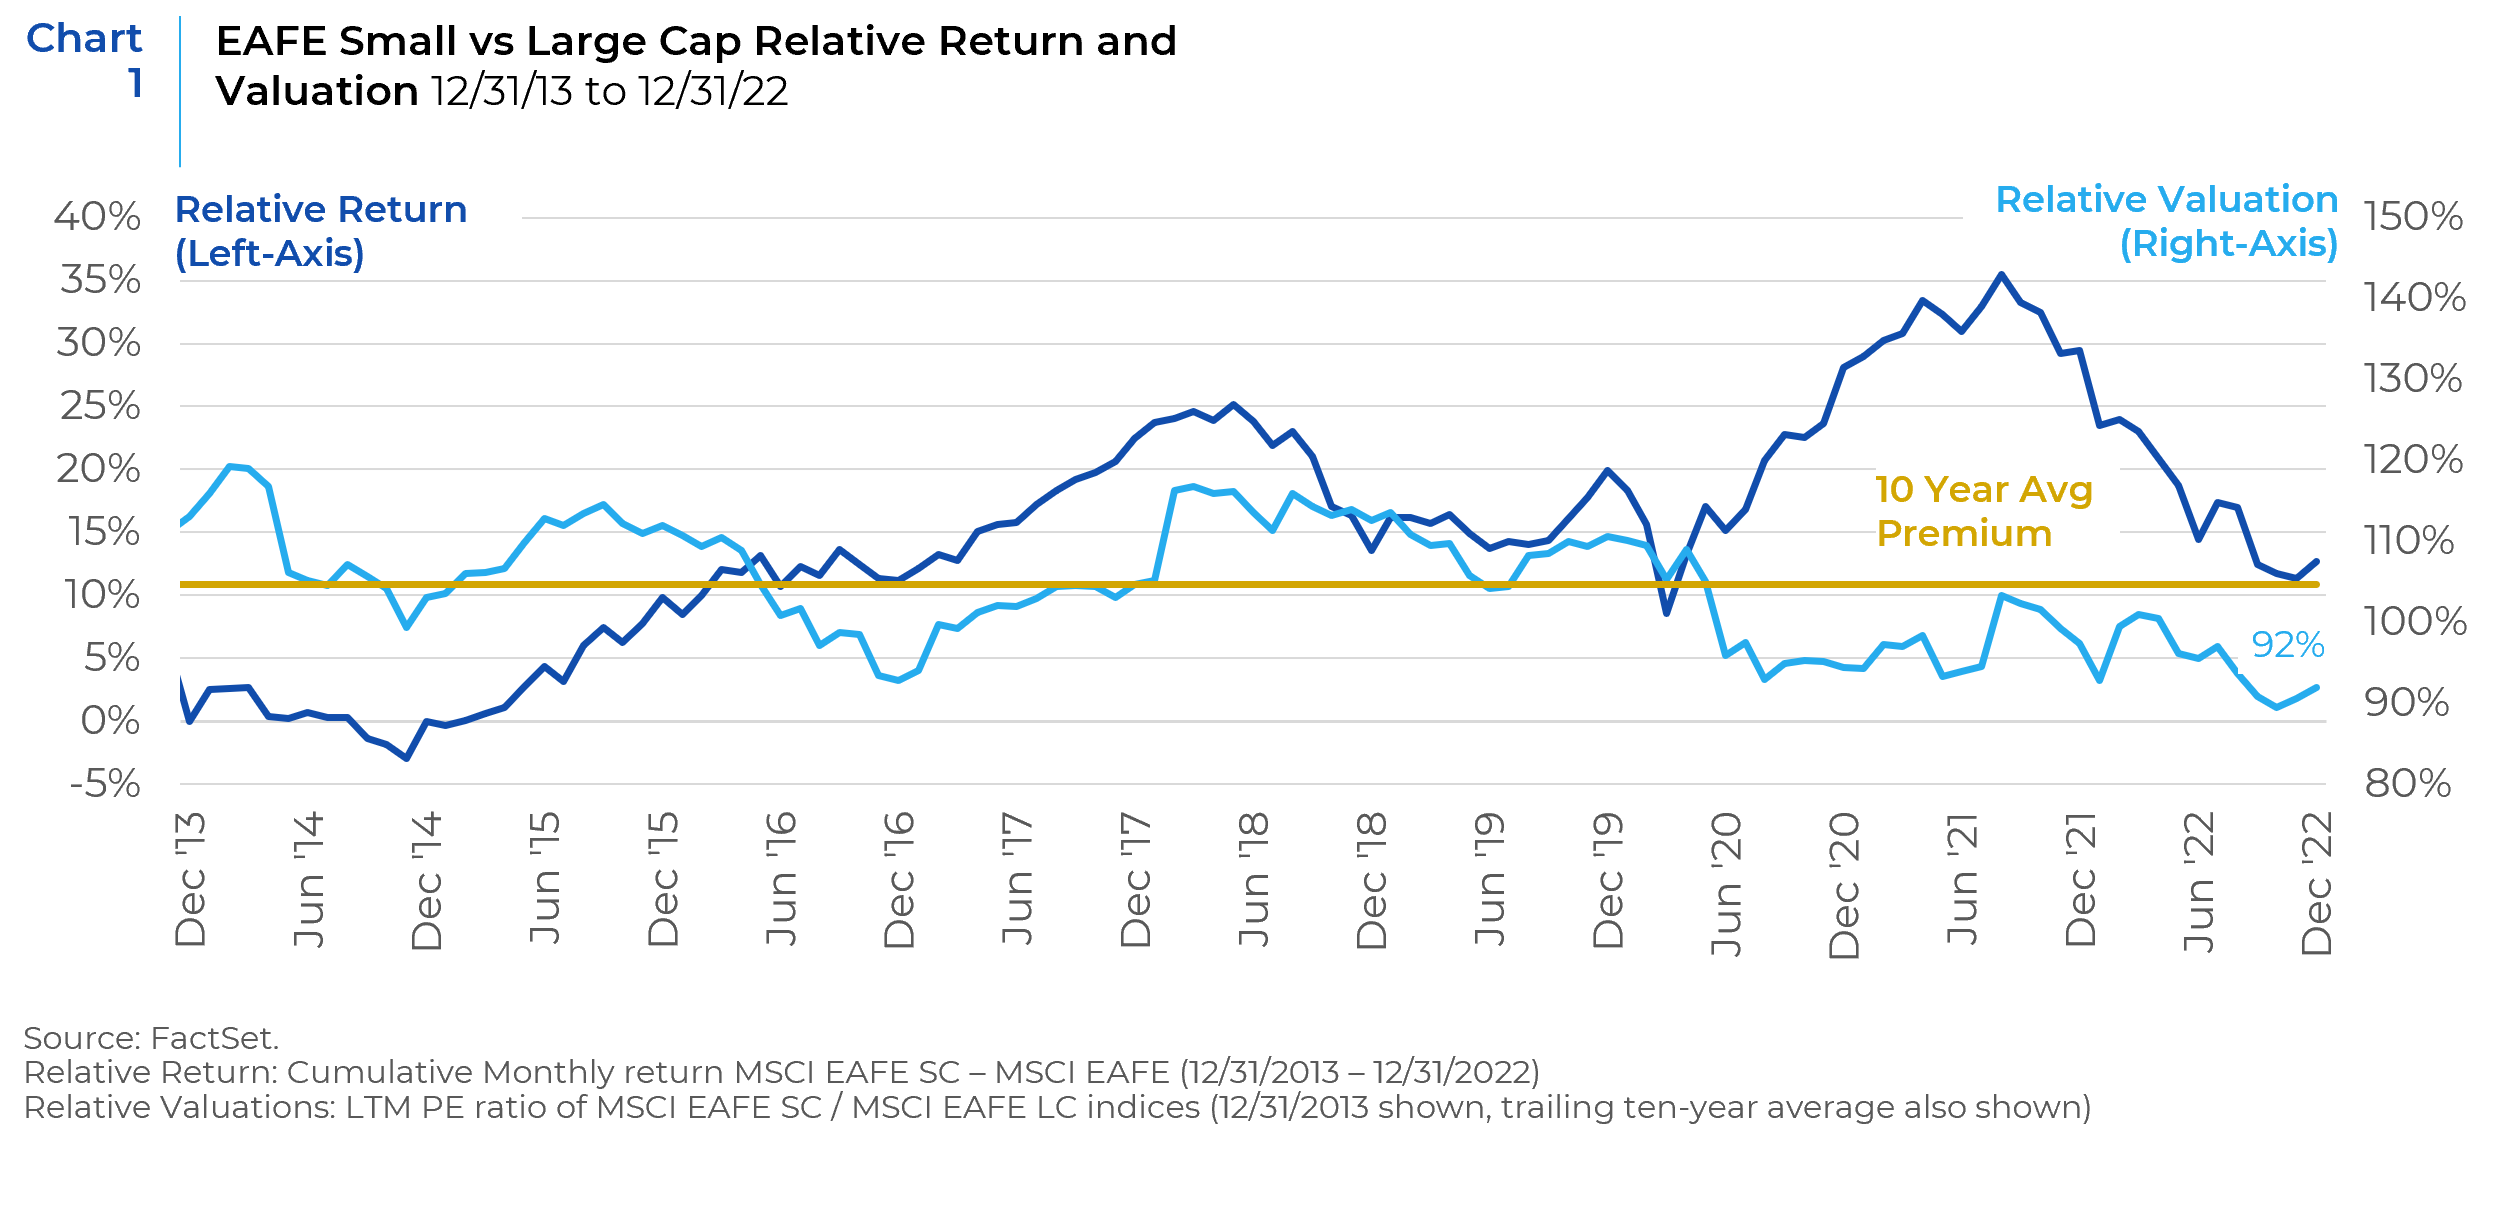
We delve into this opportunity by dissecting the fundamental differences between large and small-cap indices to see if this appears to be a buying opportunity or a fair repricing given the current environment. Important sector differences and exposures to foreign revenue produce divergent reaction functions to key macroeconomic variables. We use current index positioning and historical analysis to assess the validity of our relative performance expectations in various regimes. We also examine the exposure to recent thematic investment trends (esp. ESG and energy security). Finally, we will share the perspective of some talented international small-cap boutiques that we have partnered with.
Primary Benchmark Differences – Sector Exposures
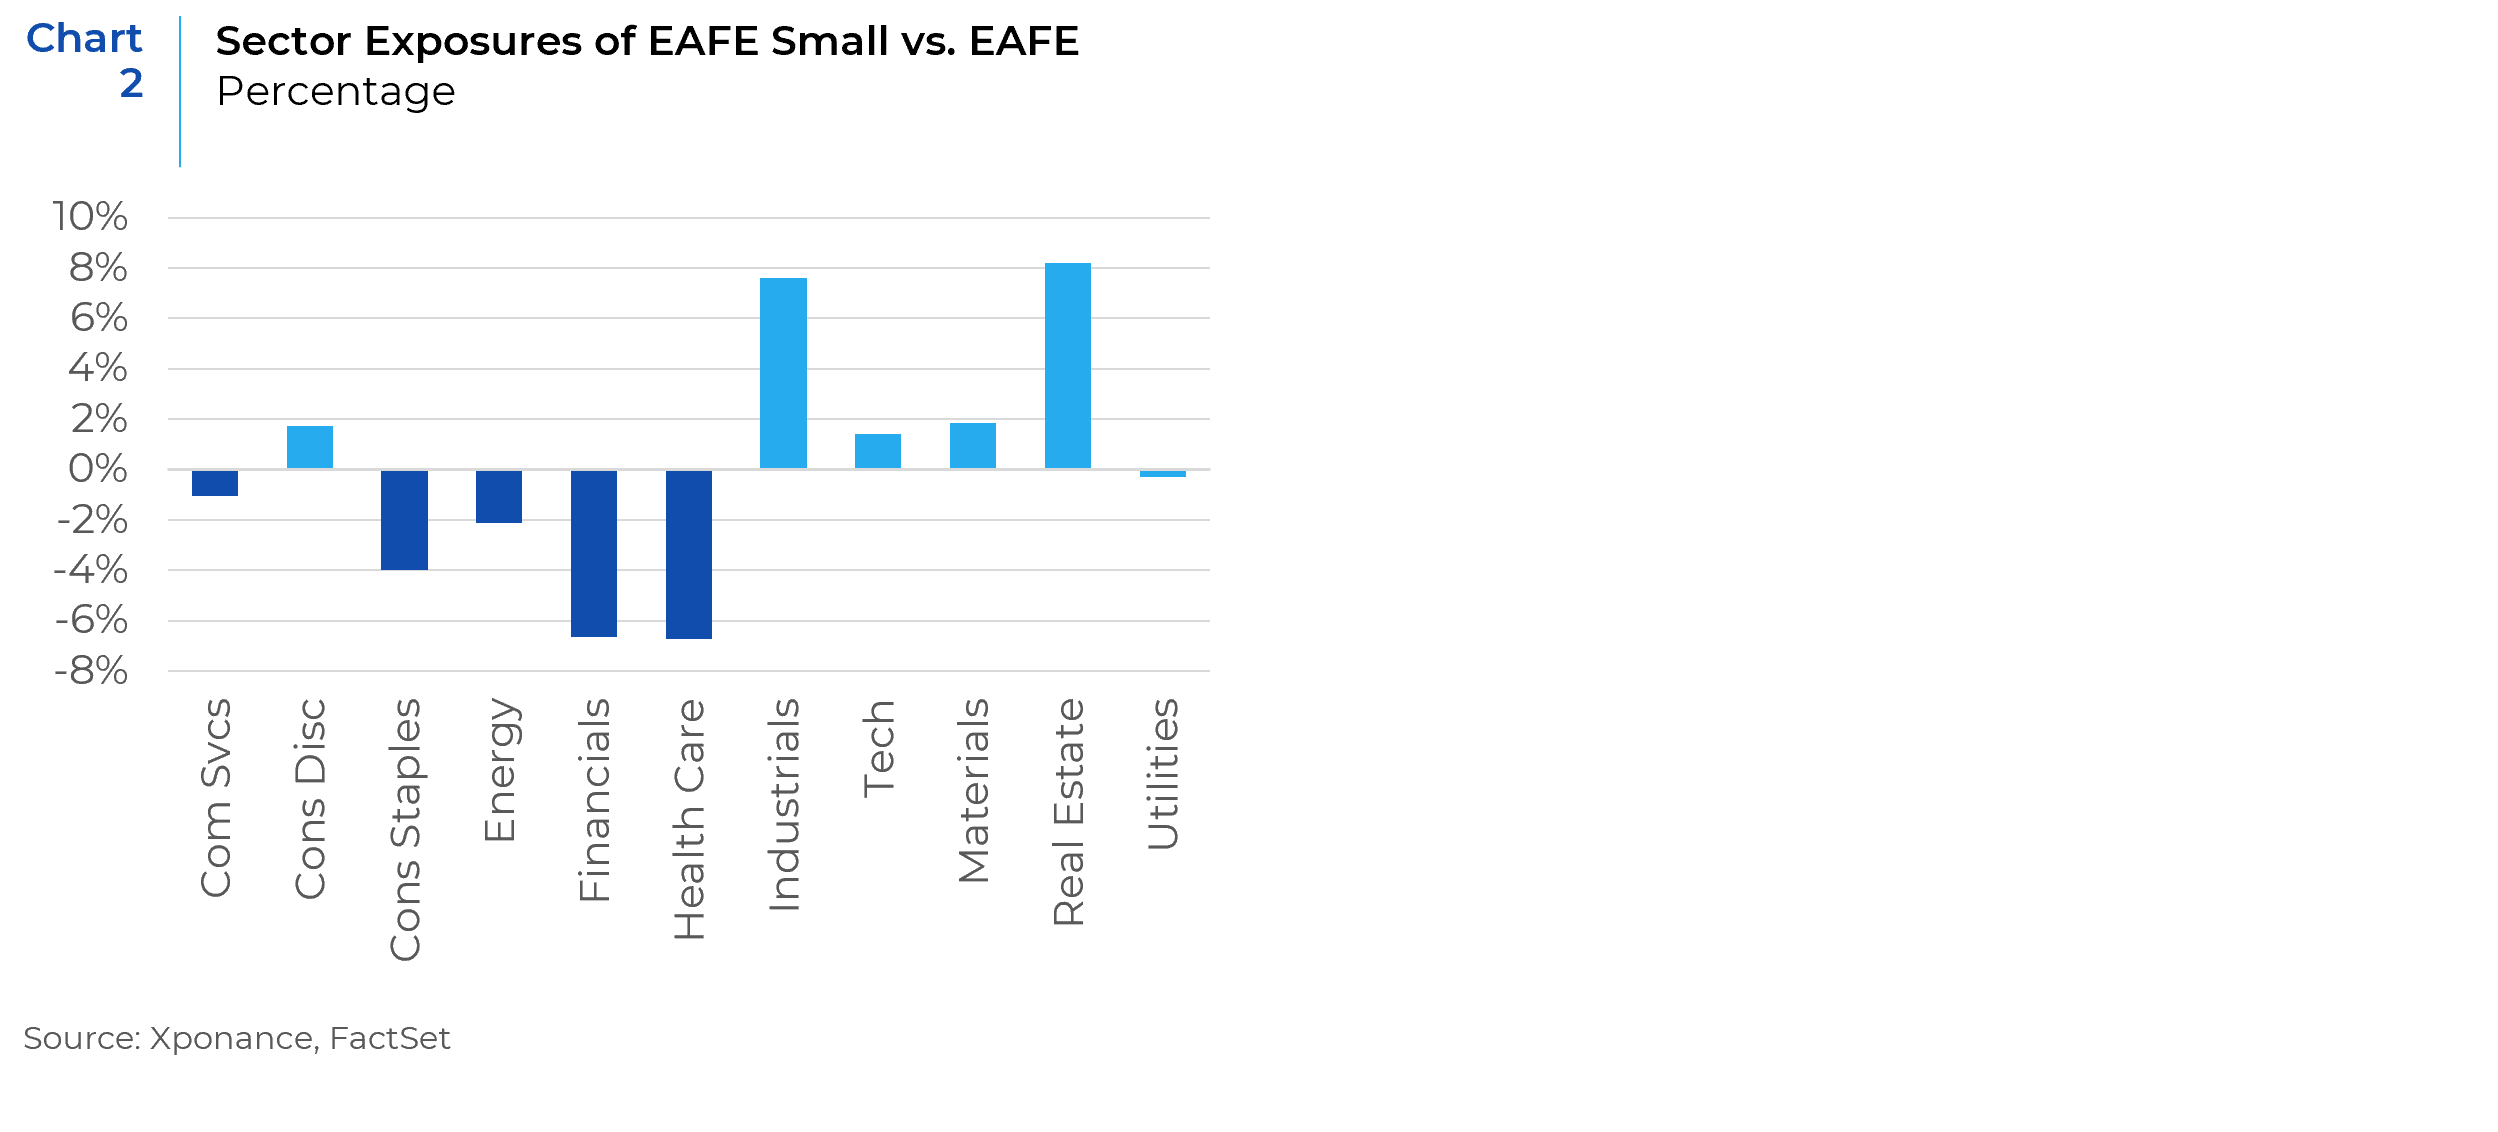
Compared to the MSCI EAFE index, small-caps have significantly larger exposures to Real Estate, Industrials, and Materials (ca. 18%) at the expense of Health Care (mostly Pharmaceuticals), Financials (mostly Banks and Insurance), and Consumer Staples.
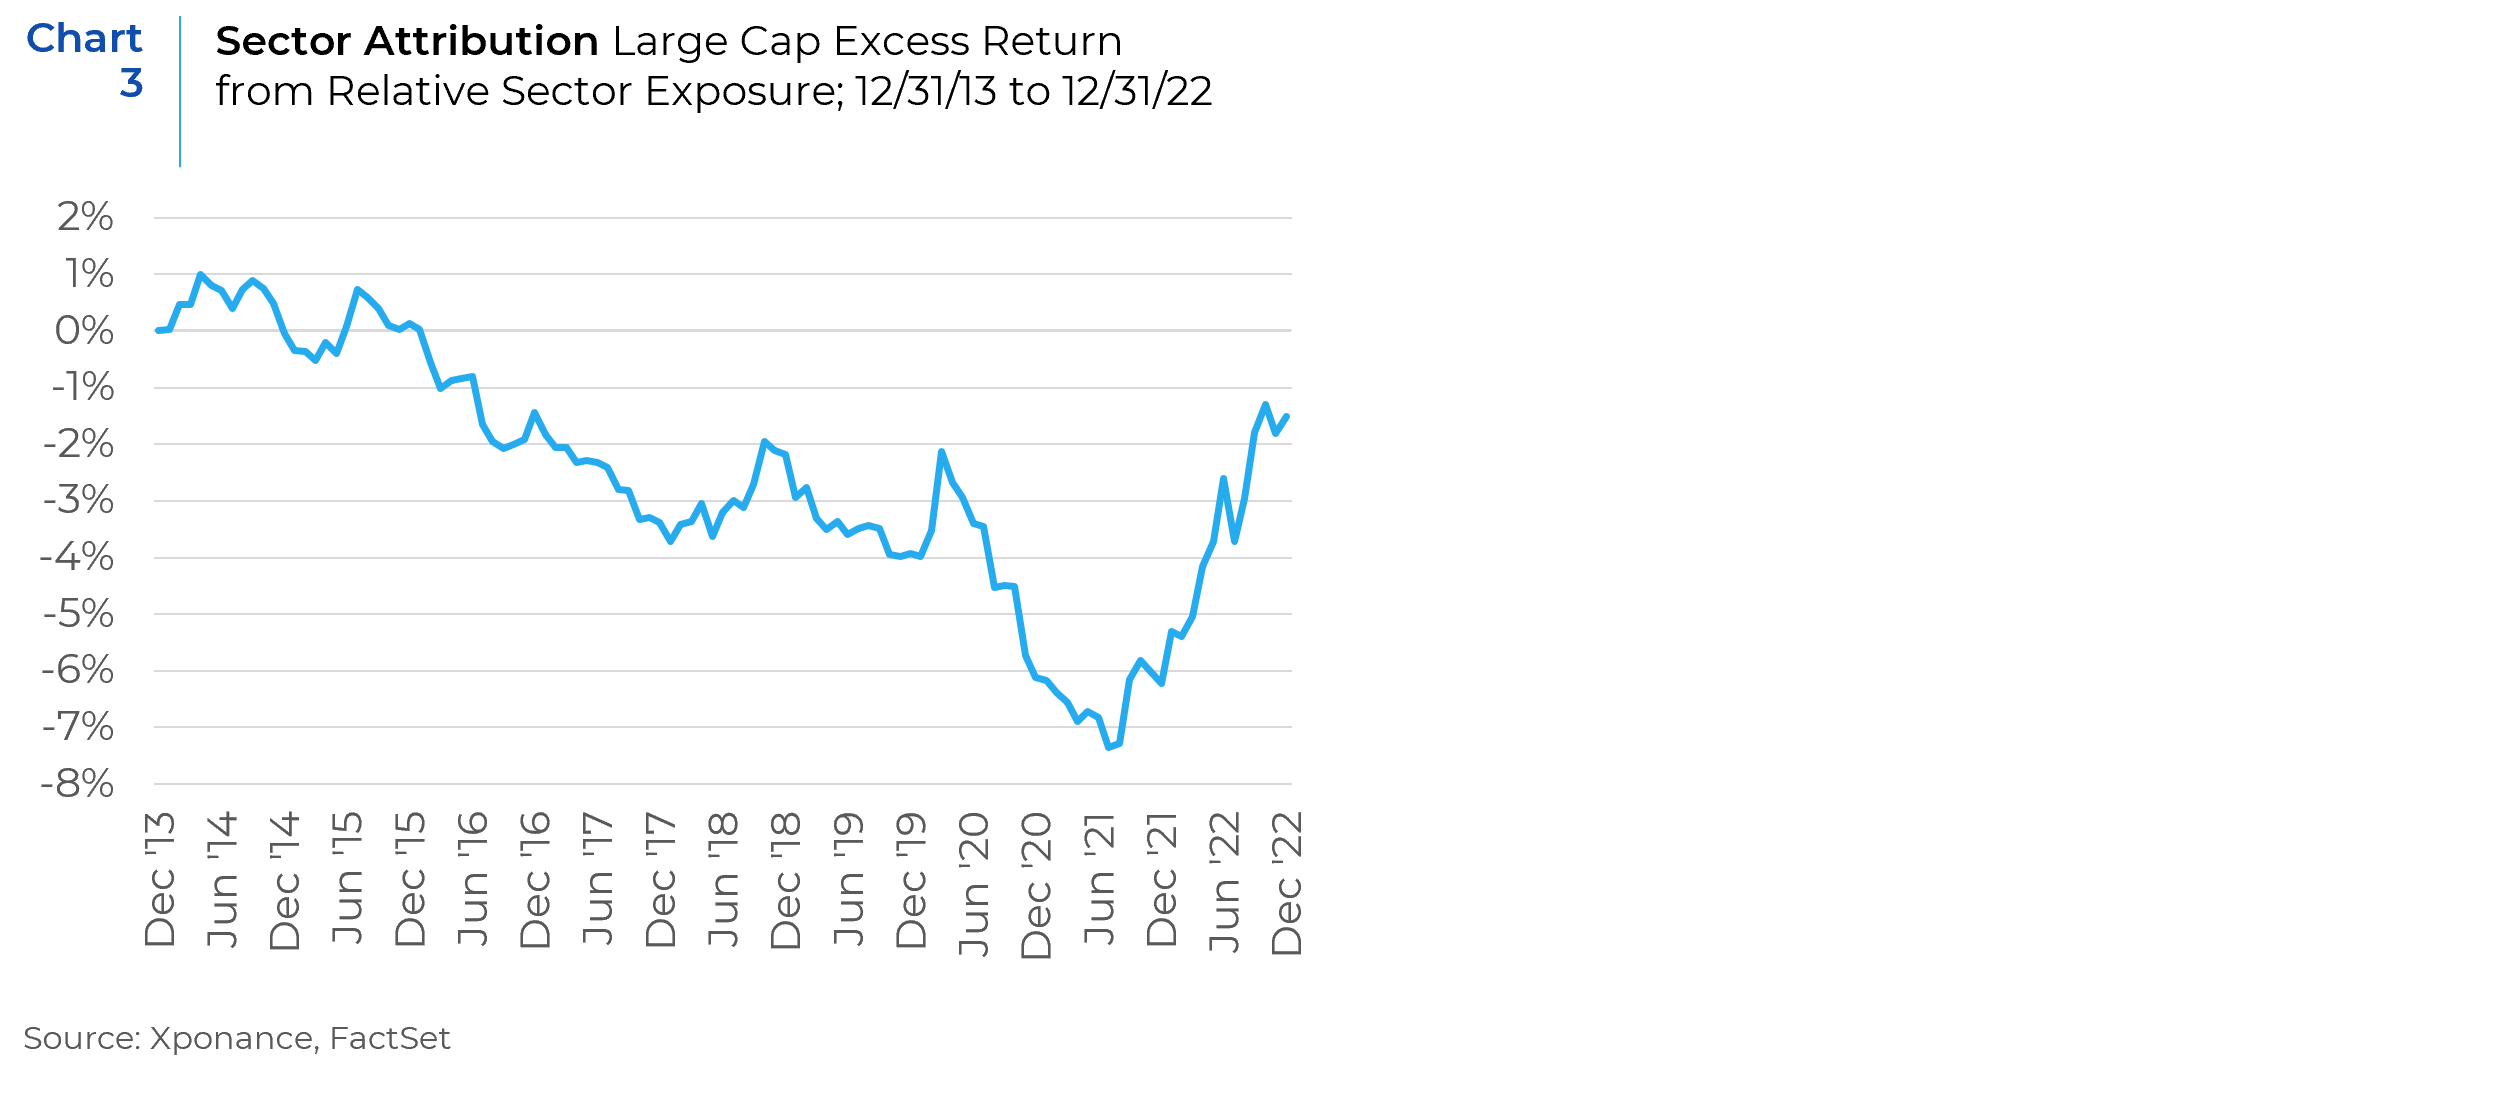
The relative sector positioning of Small-Caps was a significant tailwind before the summer of 2021, when there was a sharp regime change (Chart 3). Within a few months in mid-2021: global interest rates began to rise slowly, the US Dollar began to strengthen, energy prices (European natural gas and LNG in particular) began to rise, covid vaccines became widely available, and economies began to reopen. The underlying cause of this regime change is a bit of a Rorschach test for professional prognosticators and talking heads alike. It is impossible to disentangle these events and identify a “cause”. The critical point is that the global economy was entering a new regime.
Key Points on Sectors
- Small-Caps’ relative sector positioning would be more leveraged to economic activity.
- Small-caps are more heavily exposed to Industrials, Materials, and Real Estate (approximately 44% collectively), businesses that are more capital and resource intensive on average. We expect to see margins pressured by rising input costs (such as oil and natural gas).
- Small-caps are less weighted toward Financials and more heavily weighted toward Real Estate. These sectors are expected to have inverse reactions to the direction and level of interest rates, all else equal. High rates benefit banks and insurance companies but are negative for Real Estate without strong economic growth. Rising / high rates and a steep yield curve should help Large-Caps relative to Small-Caps, except in the event that a steep yield curve presages a pickup in economic activity, which would generally favor small caps.
Primary Benchmark Differences – Geographic Footprint of Revenue
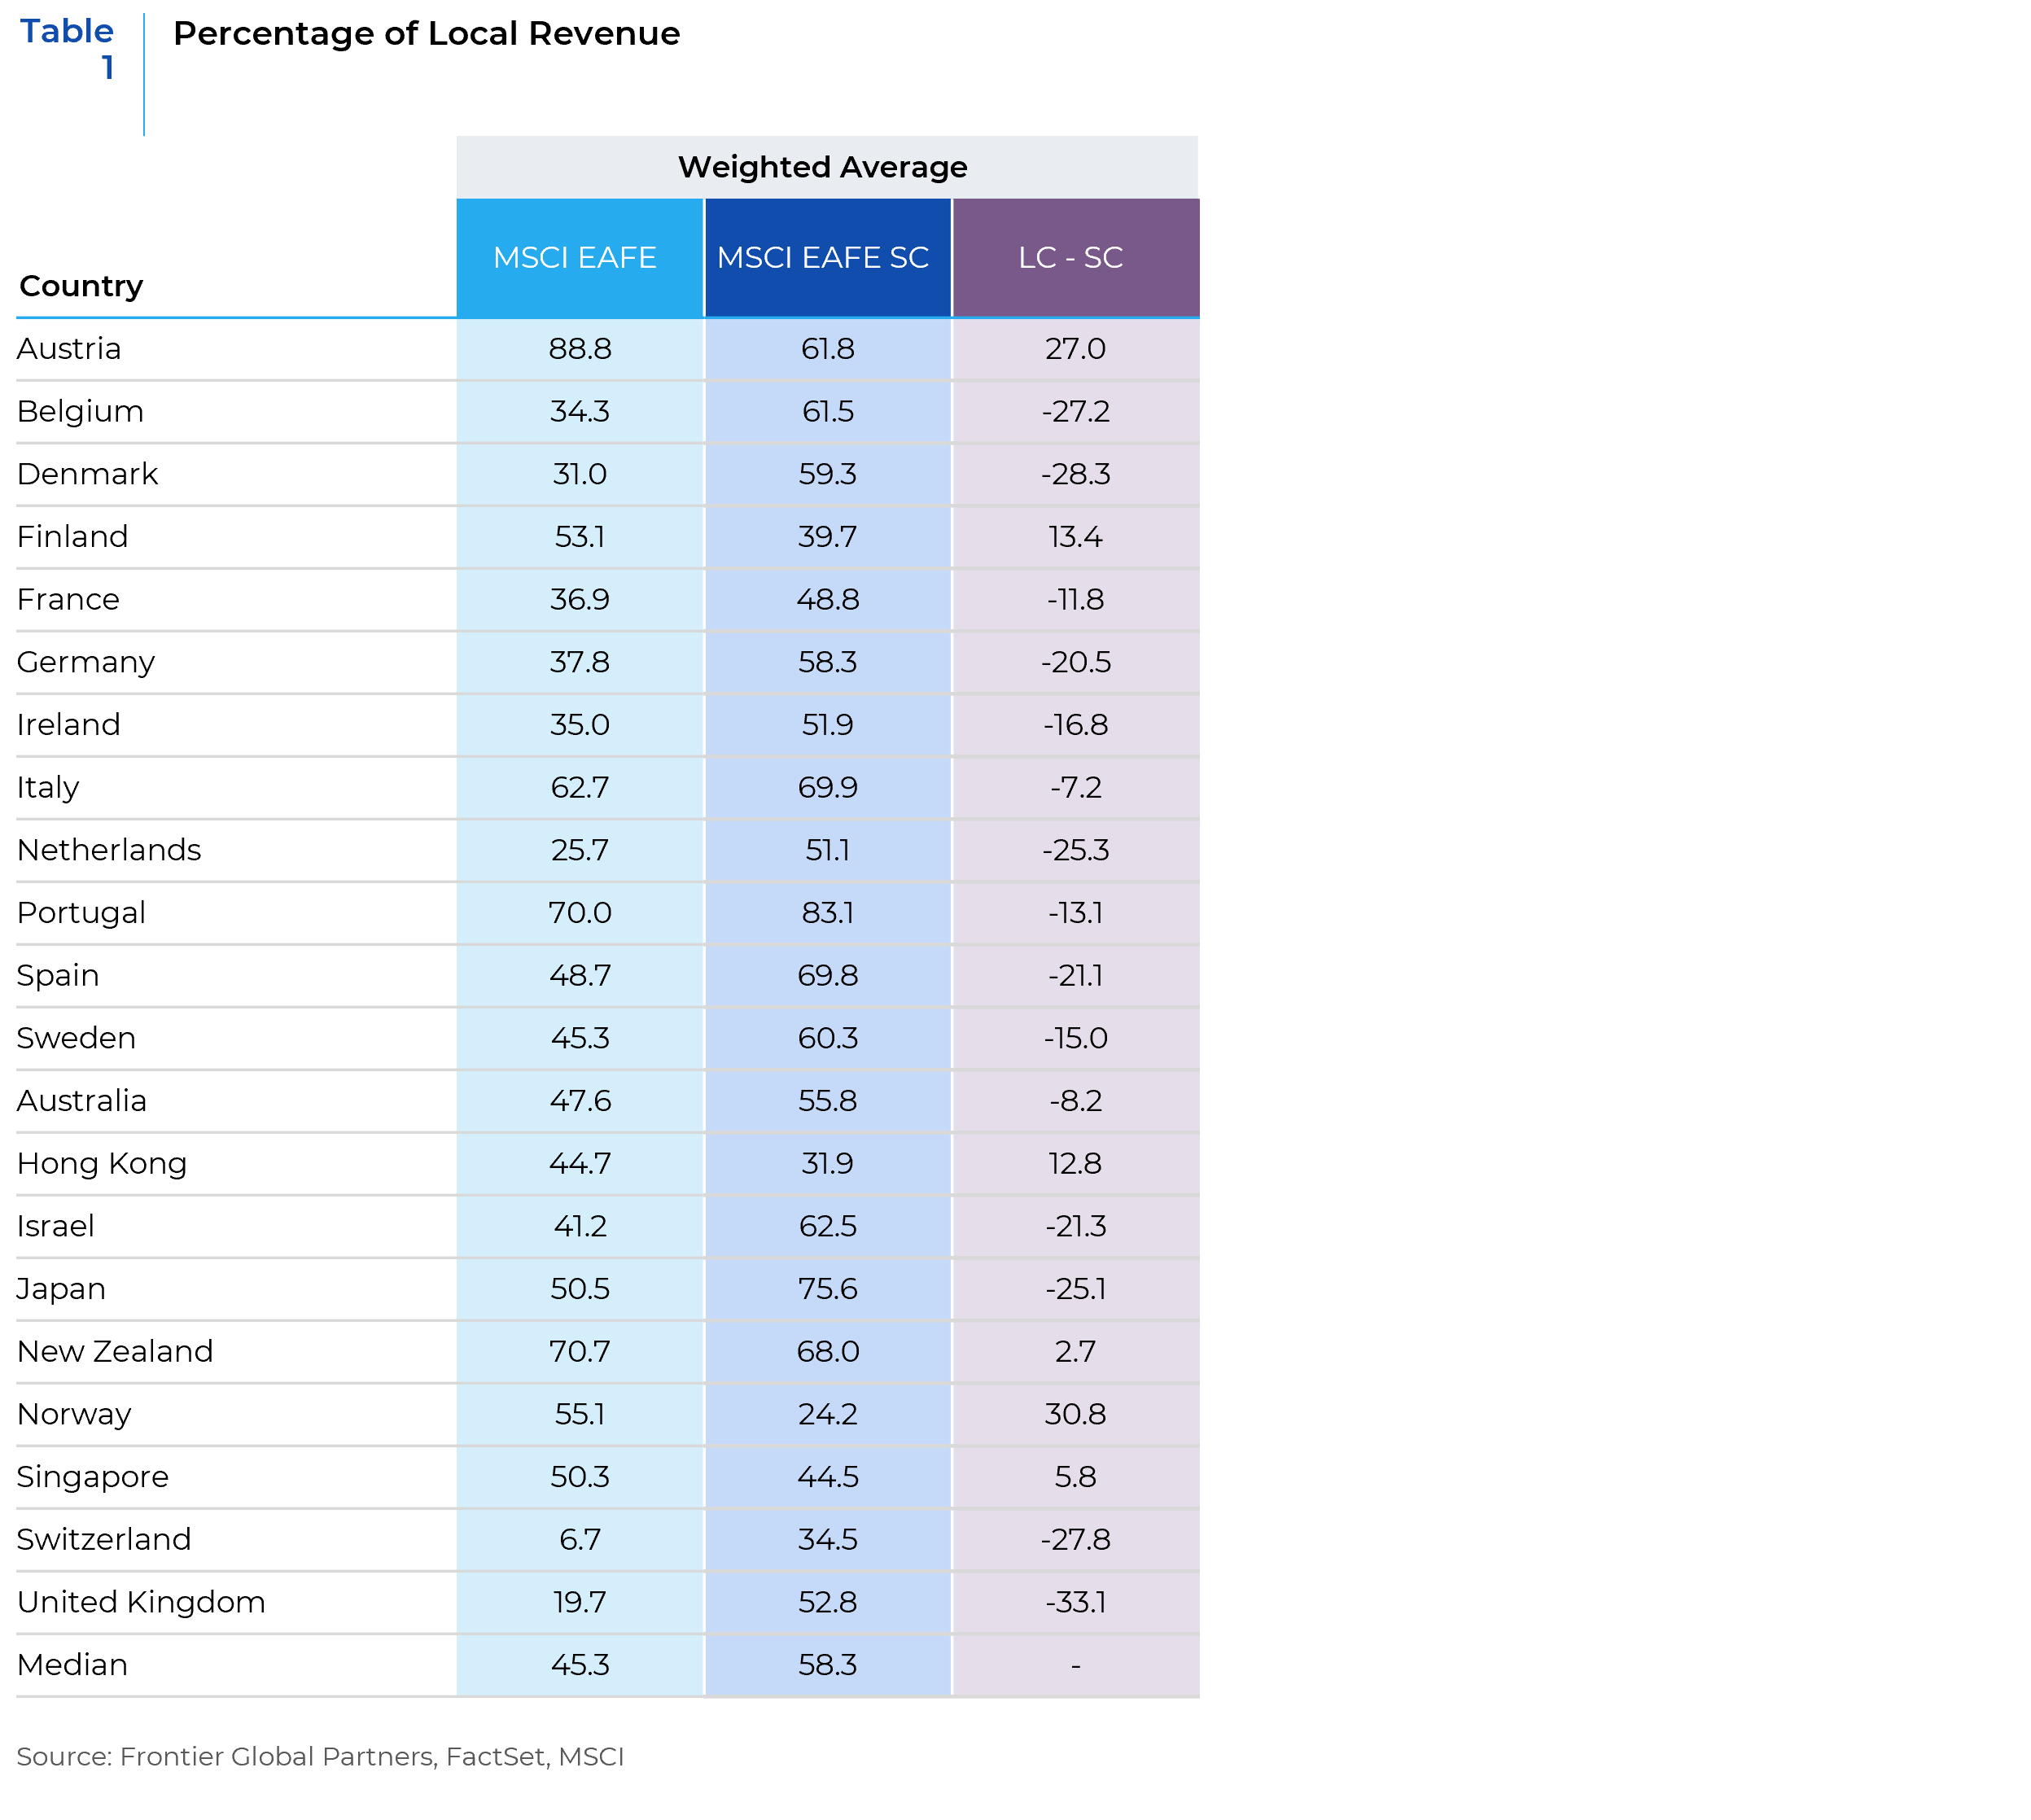
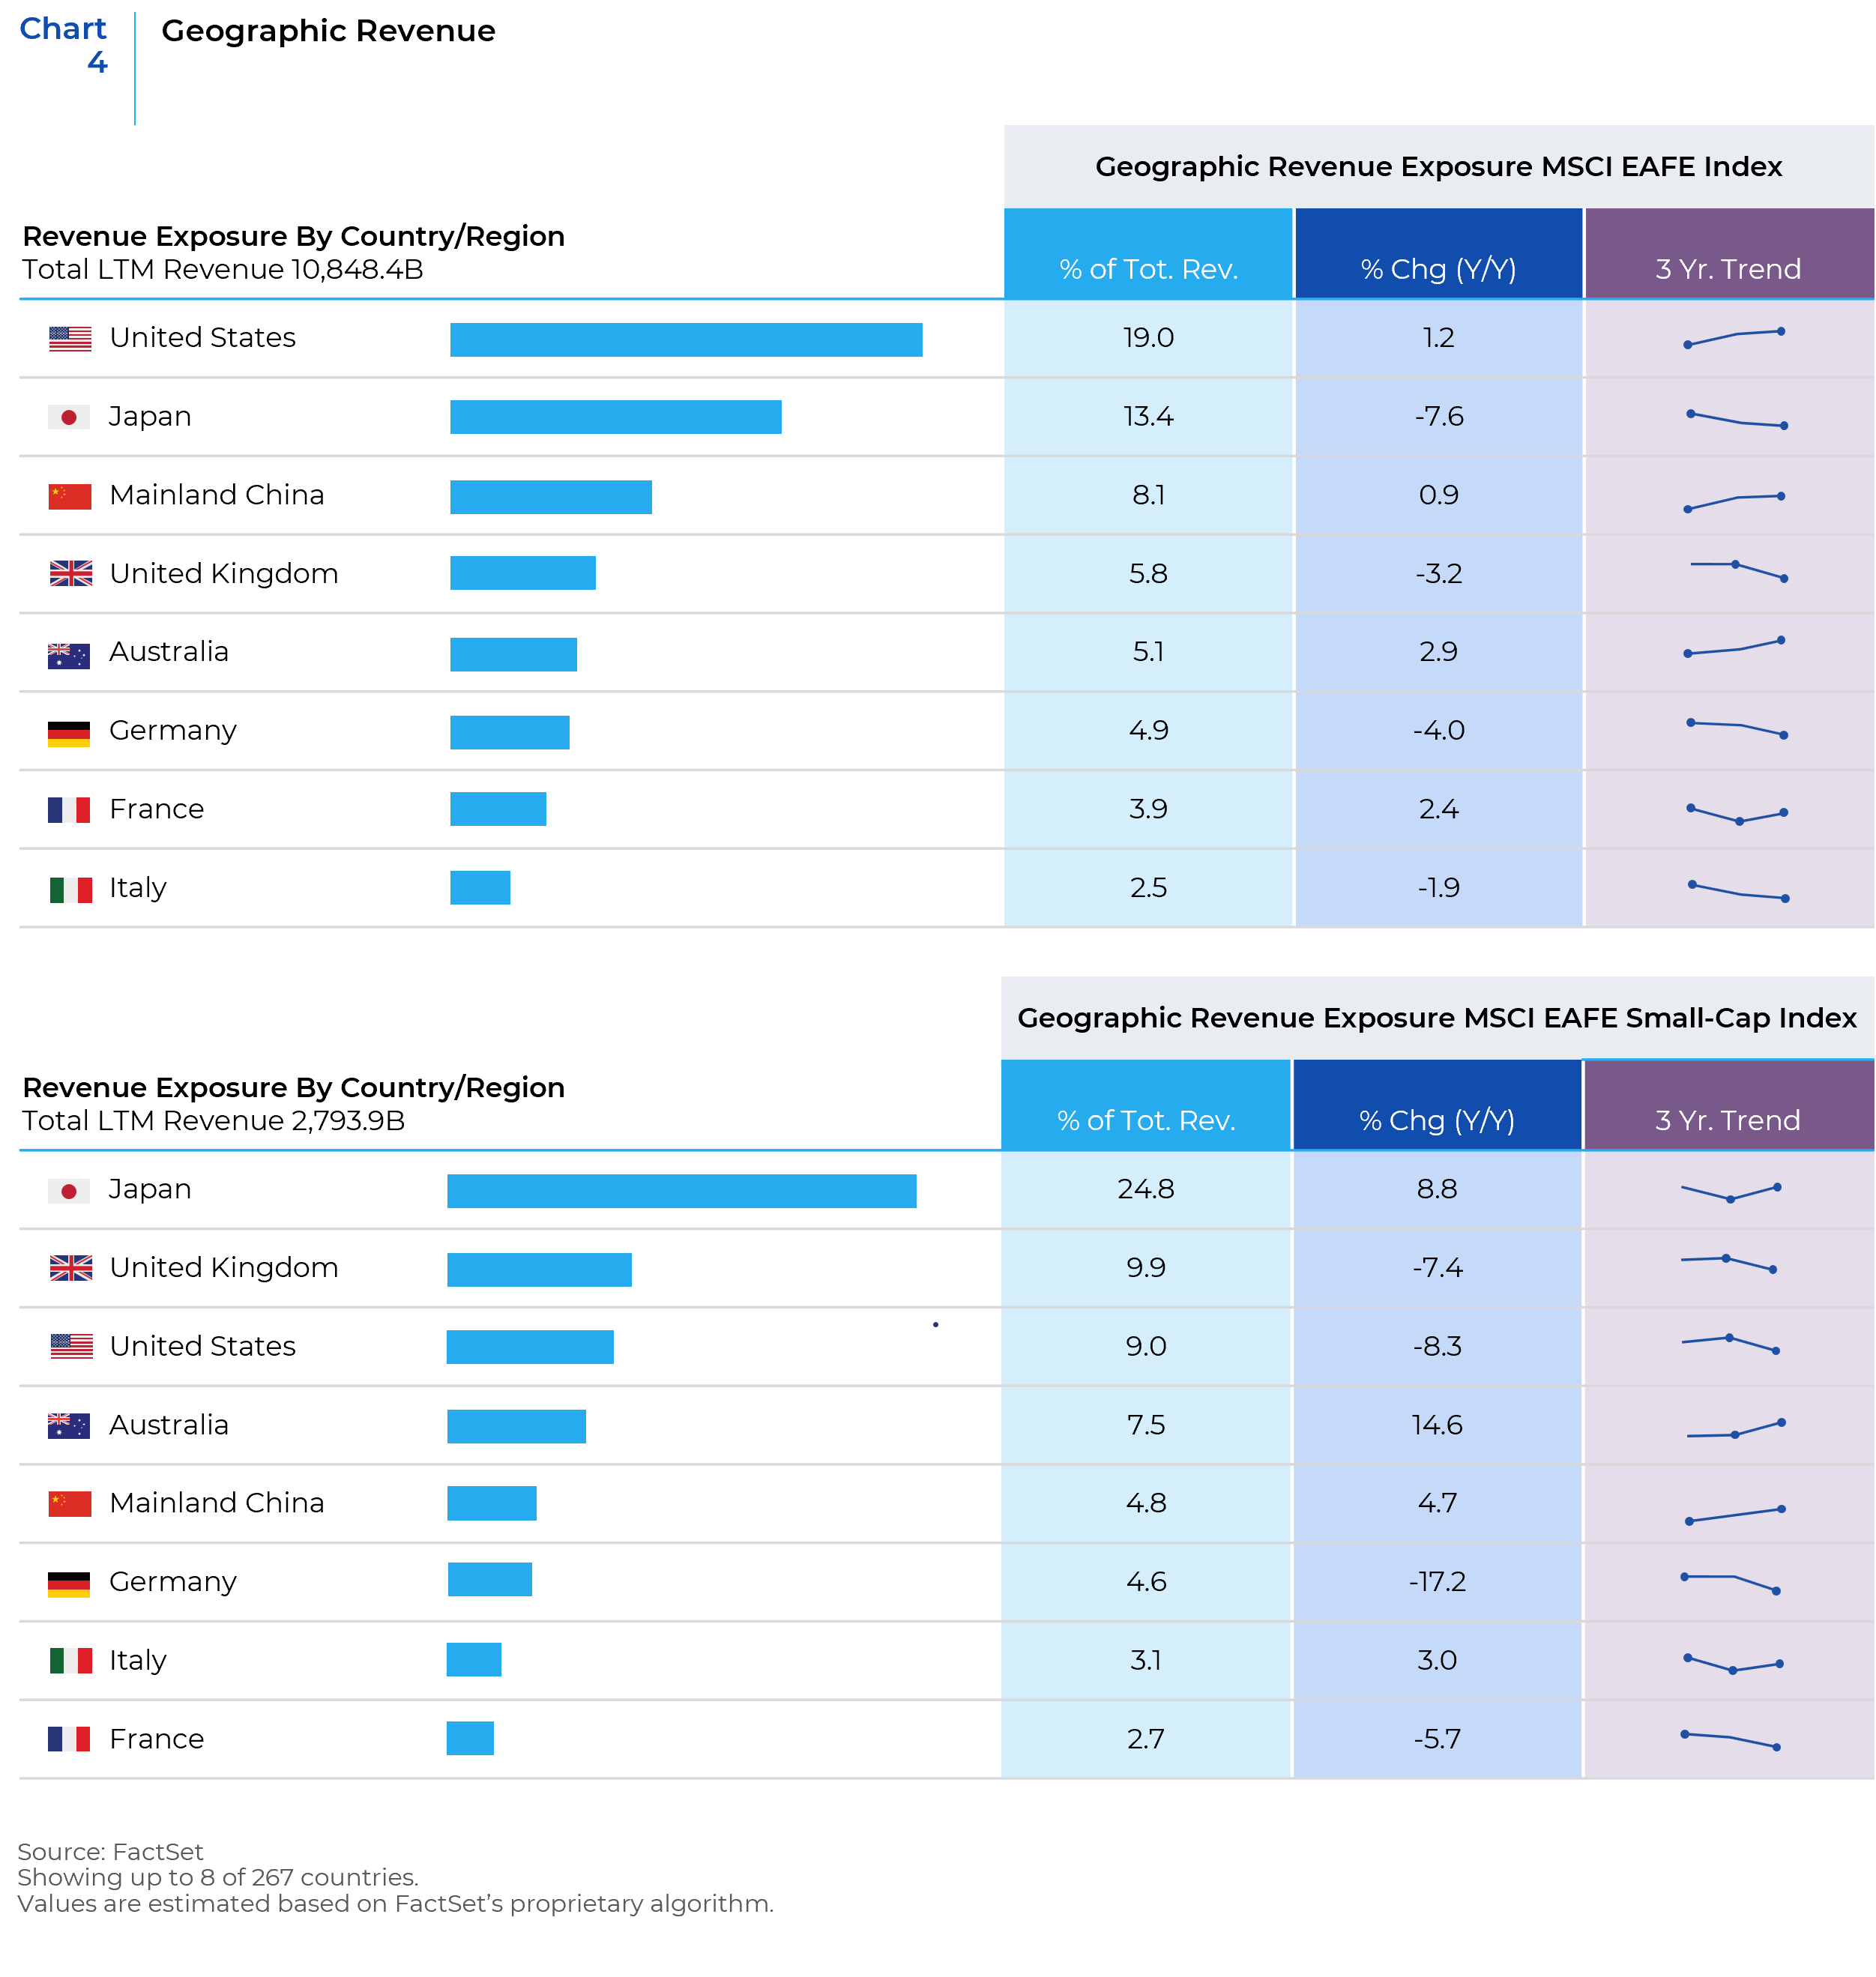
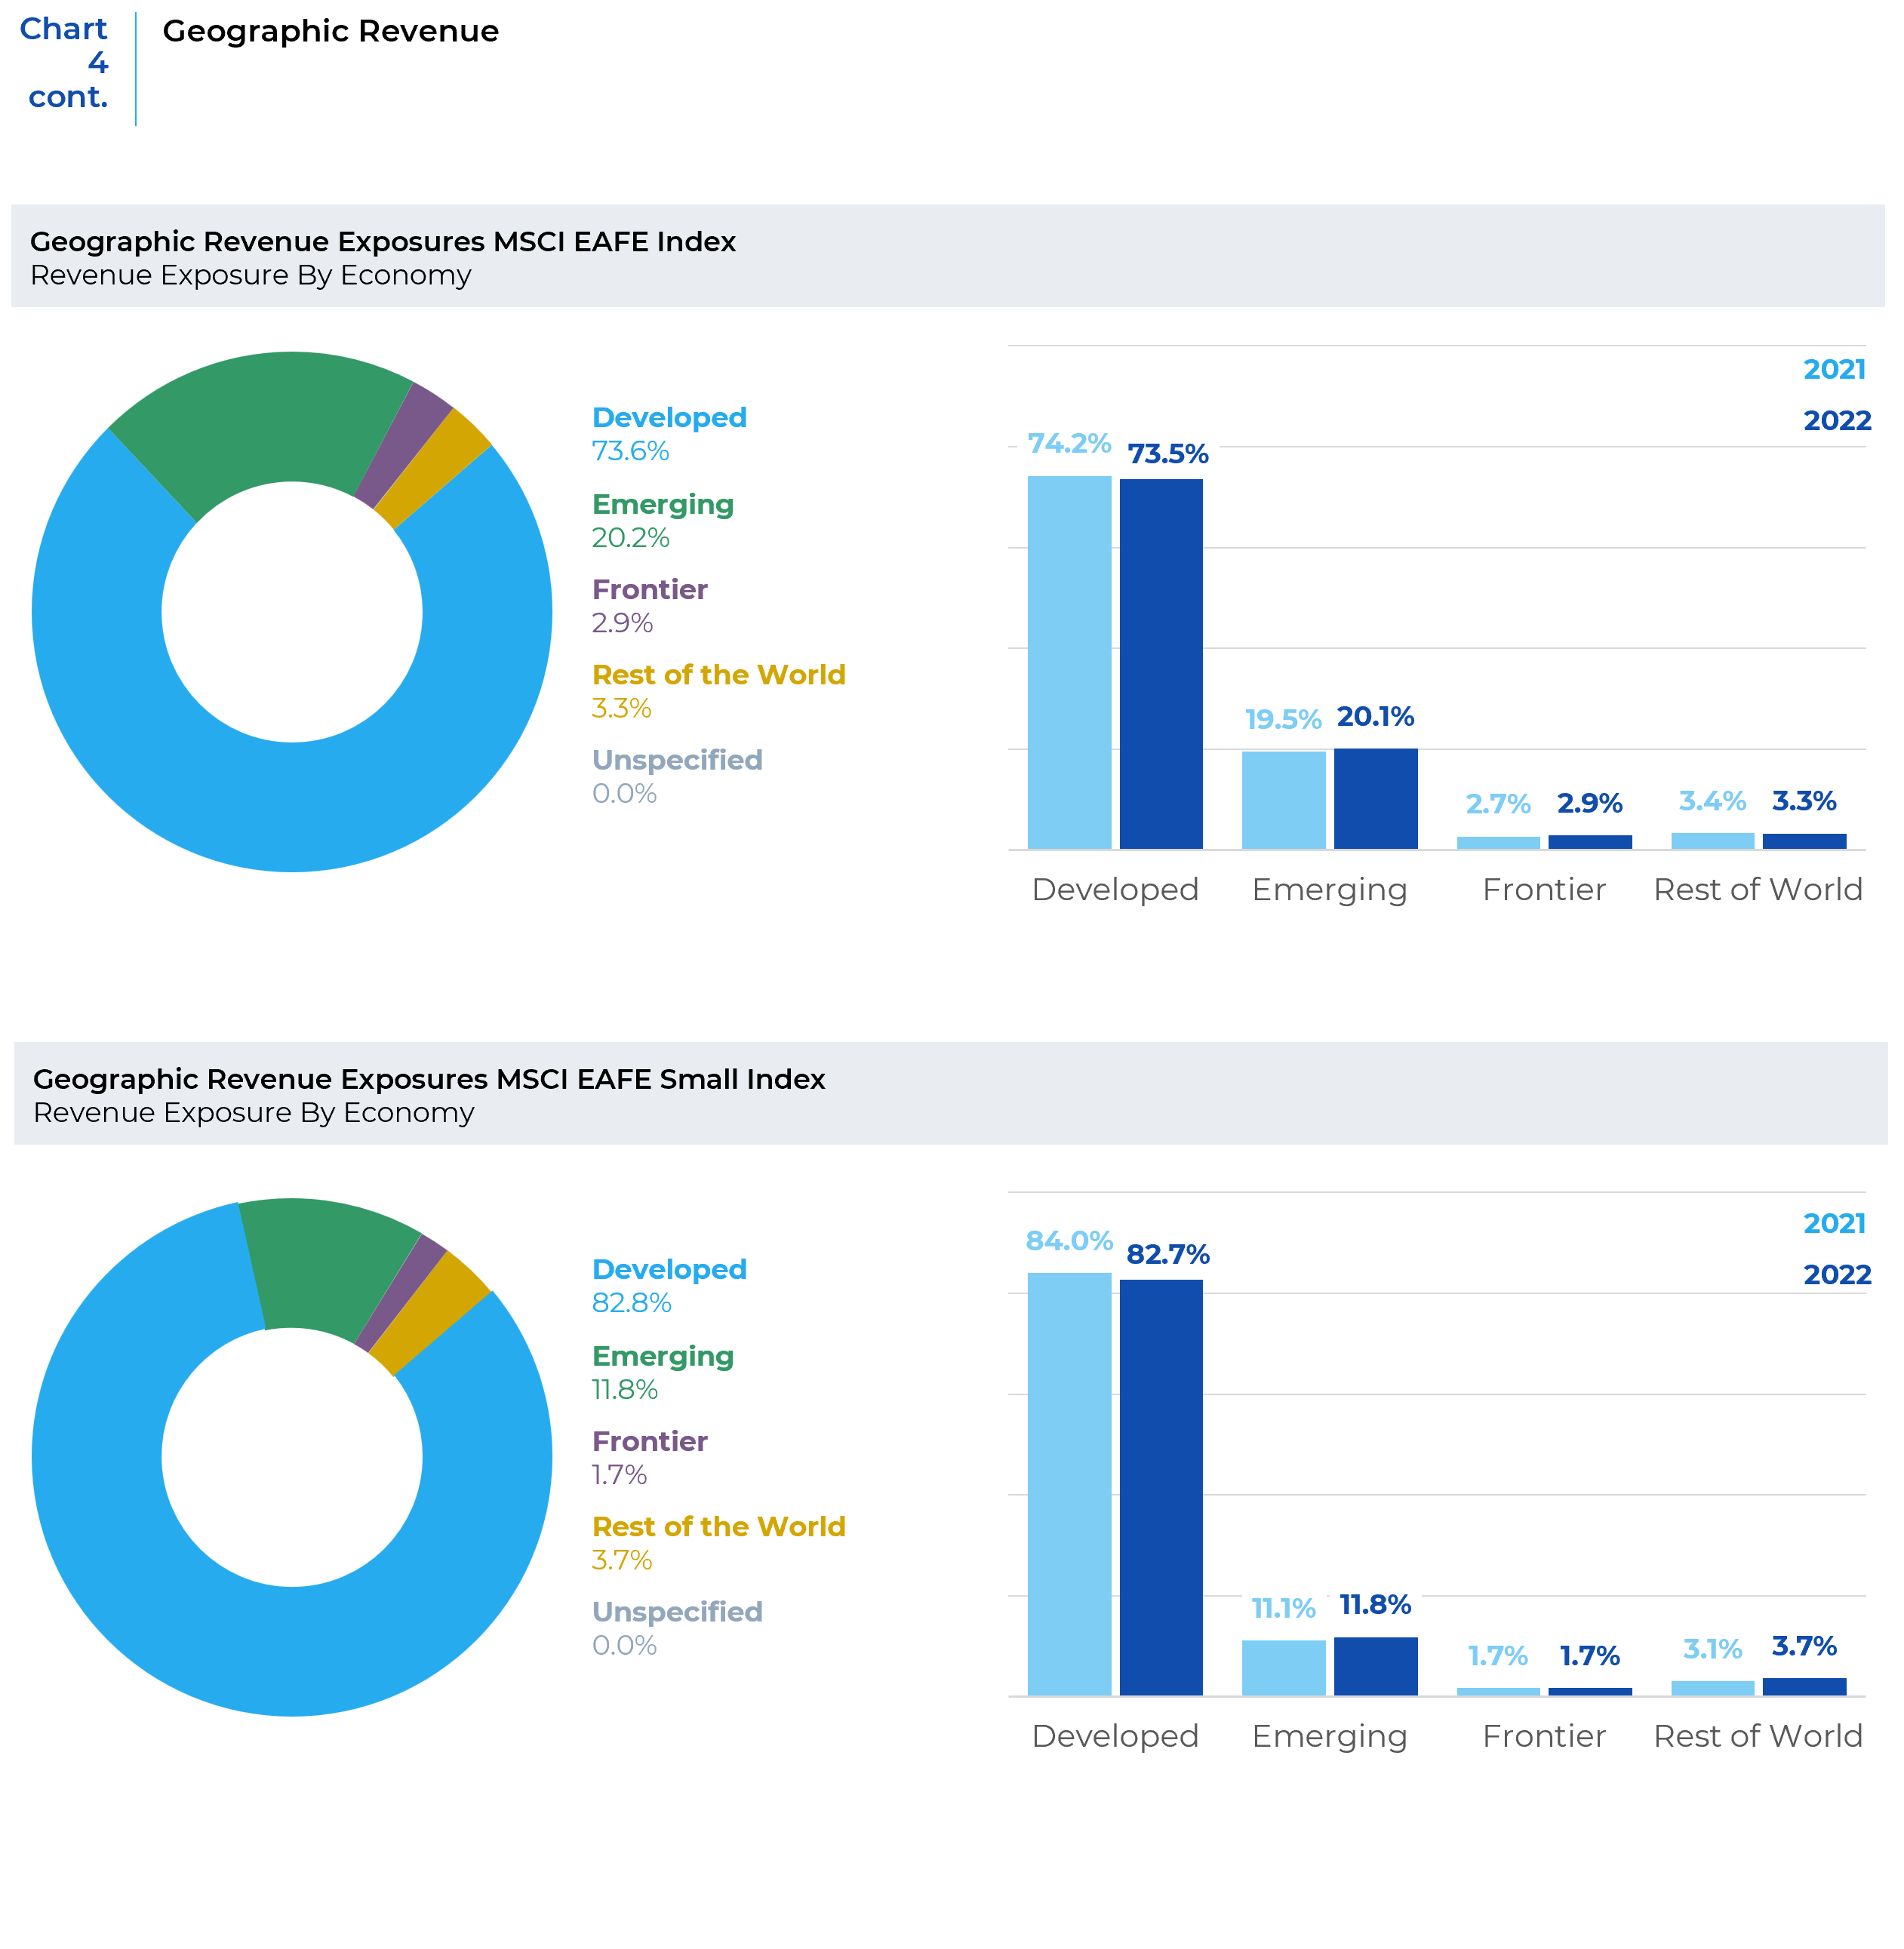
Small caps tend to be more domestic or regional businesses with revenue and costs driven by local dynamics (Table 1). This is especially true for the two largest markets of the small cap index, Japan and the UK. Small-Caps also have a notably smaller revenue exposure to non-EAFE markets, with exposure to the US and Emerging Markets, particularly Mainland China, being the primary differences (Chart 4). Local market focus has the potential to be an important differentiator when analyzing the impact of Macro variables. We will look deeper at some potential drivers later in the paper.
Potential Return Drivers
Understanding the types of businesses and where they operate helps provide a framework for projecting the relative performance of small vs. large cap international stocks. Below, we discuss the more complex task of forecasting performance through the lens of critical Macro risk factors.
Energy Prices and Input Inflation
As mentioned earlier, small-caps are more heavily exposed to sectors that are more capital and resource intensive on average. We expect to see margins pressured by rising input costs (such as oil and natural gas). You can observe this with the aggregate index characteristics seen in Chart 5.
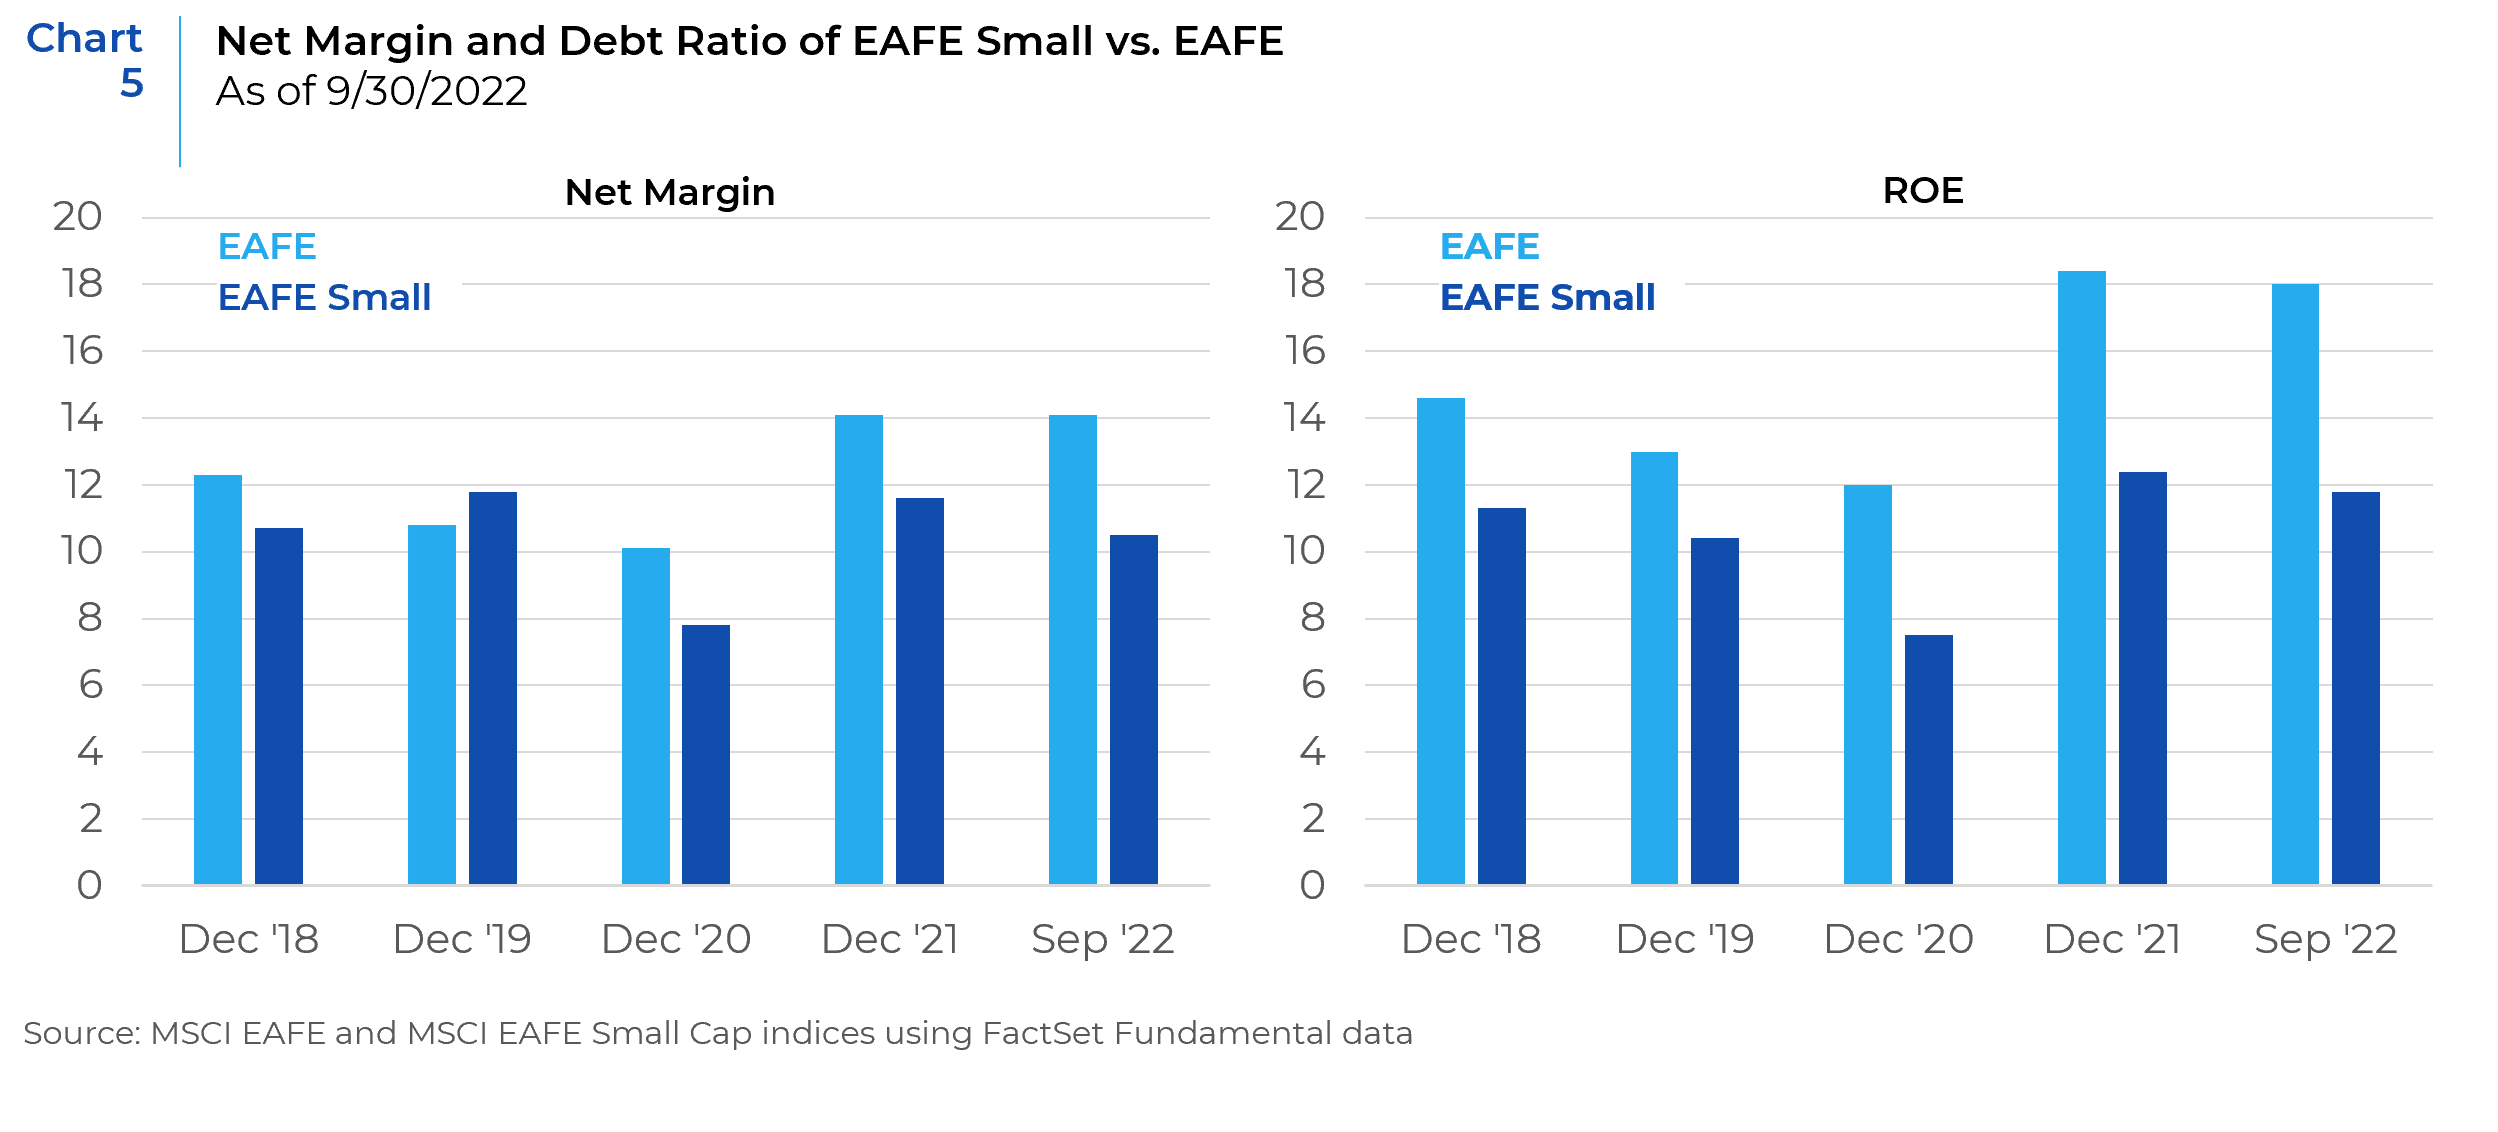
Chart 6 examines the performance difference between the EAFE Large vs. Small cap indices during rising and falling energy price regimes. We excluded the most recent three years due to the exogenous factors and the extreme magnitude of the energy price spike between March 2020 and August 2022 (1,377% rise). Small-caps outperformed by 6% during the excluded period. Even with this exclusion, EAFE small cap stocks substantially underperformed their large cap counterparts during periods of rising oil prices. This contradictory result does not disprove the higher sensitivity of small-caps to energy costs, rather the complex interdependent nature of Macro return drivers.
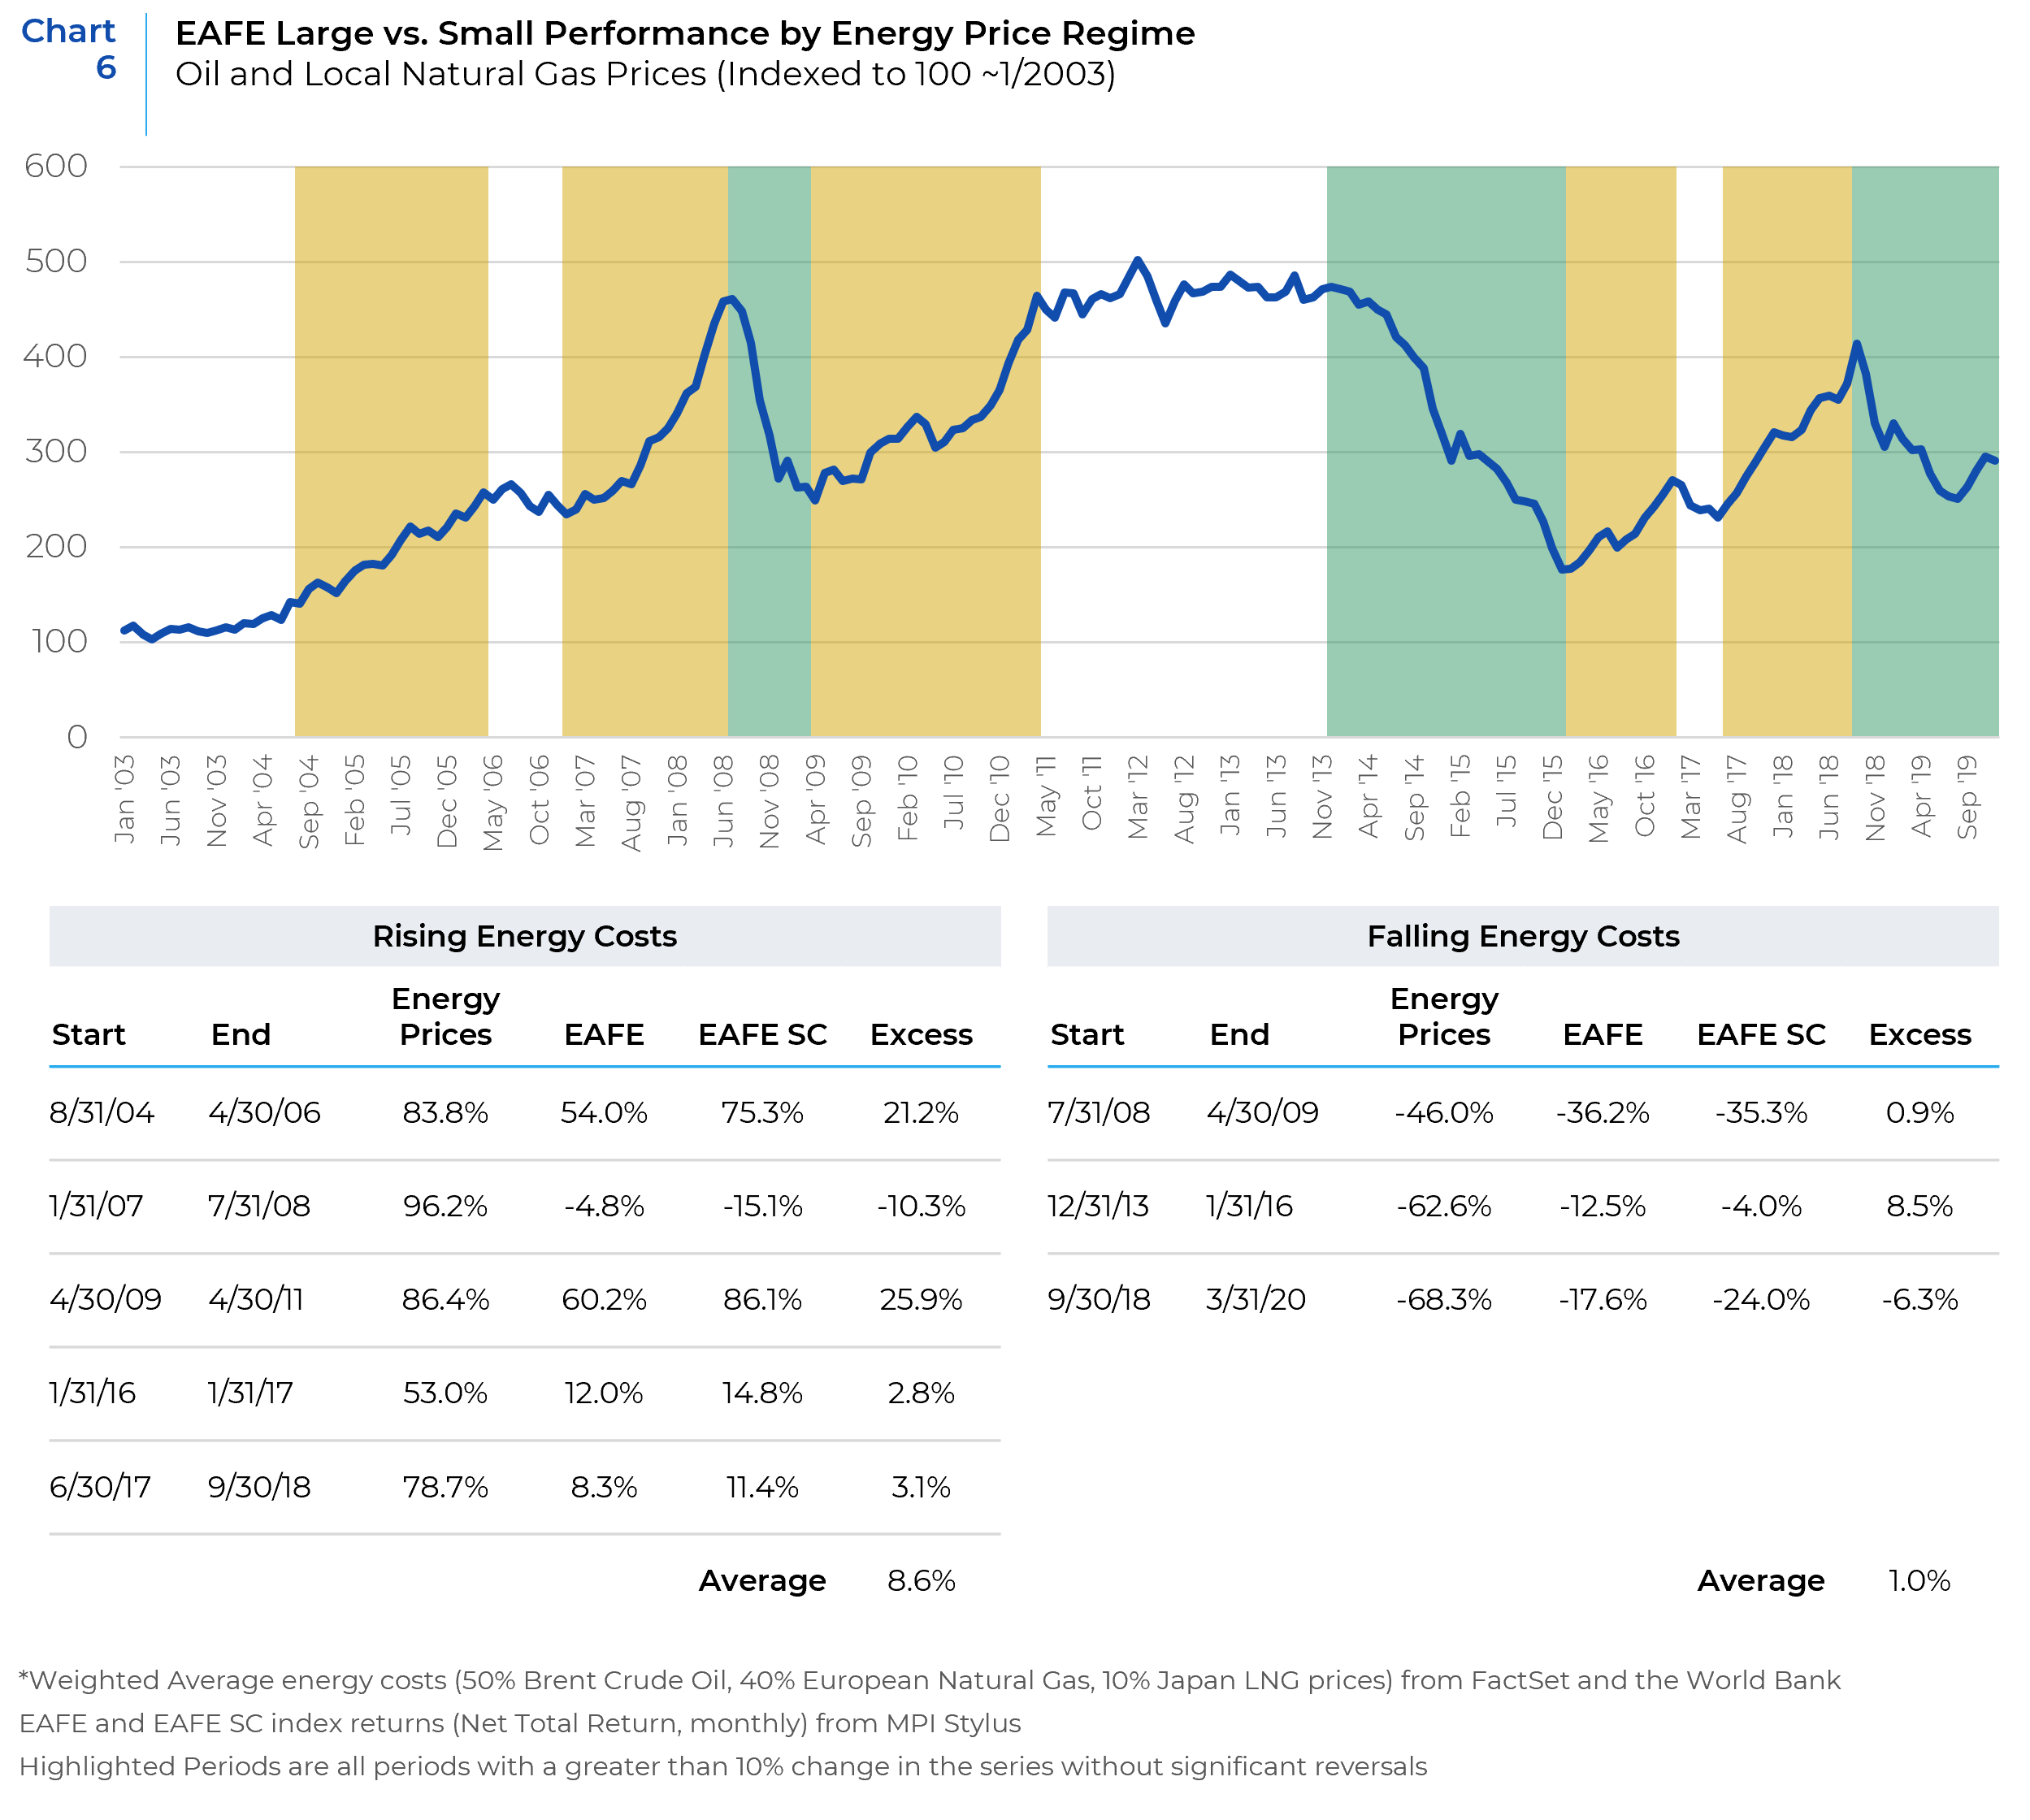
While continued easing of energy supply pressures should support the fundamentals of all international stocks, particularly European markets that have been weighed down by extreme natural gas prices, we expect the impact to be negligible for the small vs. large allocation decision. Instead, any tailwinds or headwinds to small caps is more likely to flow from a confluence of factors relating to moderating inflation (if that does continue to play out). Unfortunately, the lack of material inflationary pressures in EAFE markets over the past 15+ years makes the direct relationship between inflation and performance by market cap segment difficult to meaningfully analyze.
Interest Rates and Currencies
The two most rate-sensitive sectors (Financials and Real Estate) have a 15% difference in relative weight in the EAFE Small-cap benchmark. Historical analysis is fruitless concerning interest rates given that between 2008 and 2021, outside of periods of stress in Europe and the UK in 2010 and 2011, real sovereign bonds were falling or negative. The impact of rising rates and steepening yield curves from this point forward will likely benefit large-cap stocks at the margin, given their more significant exposure to banks relative to REITs.
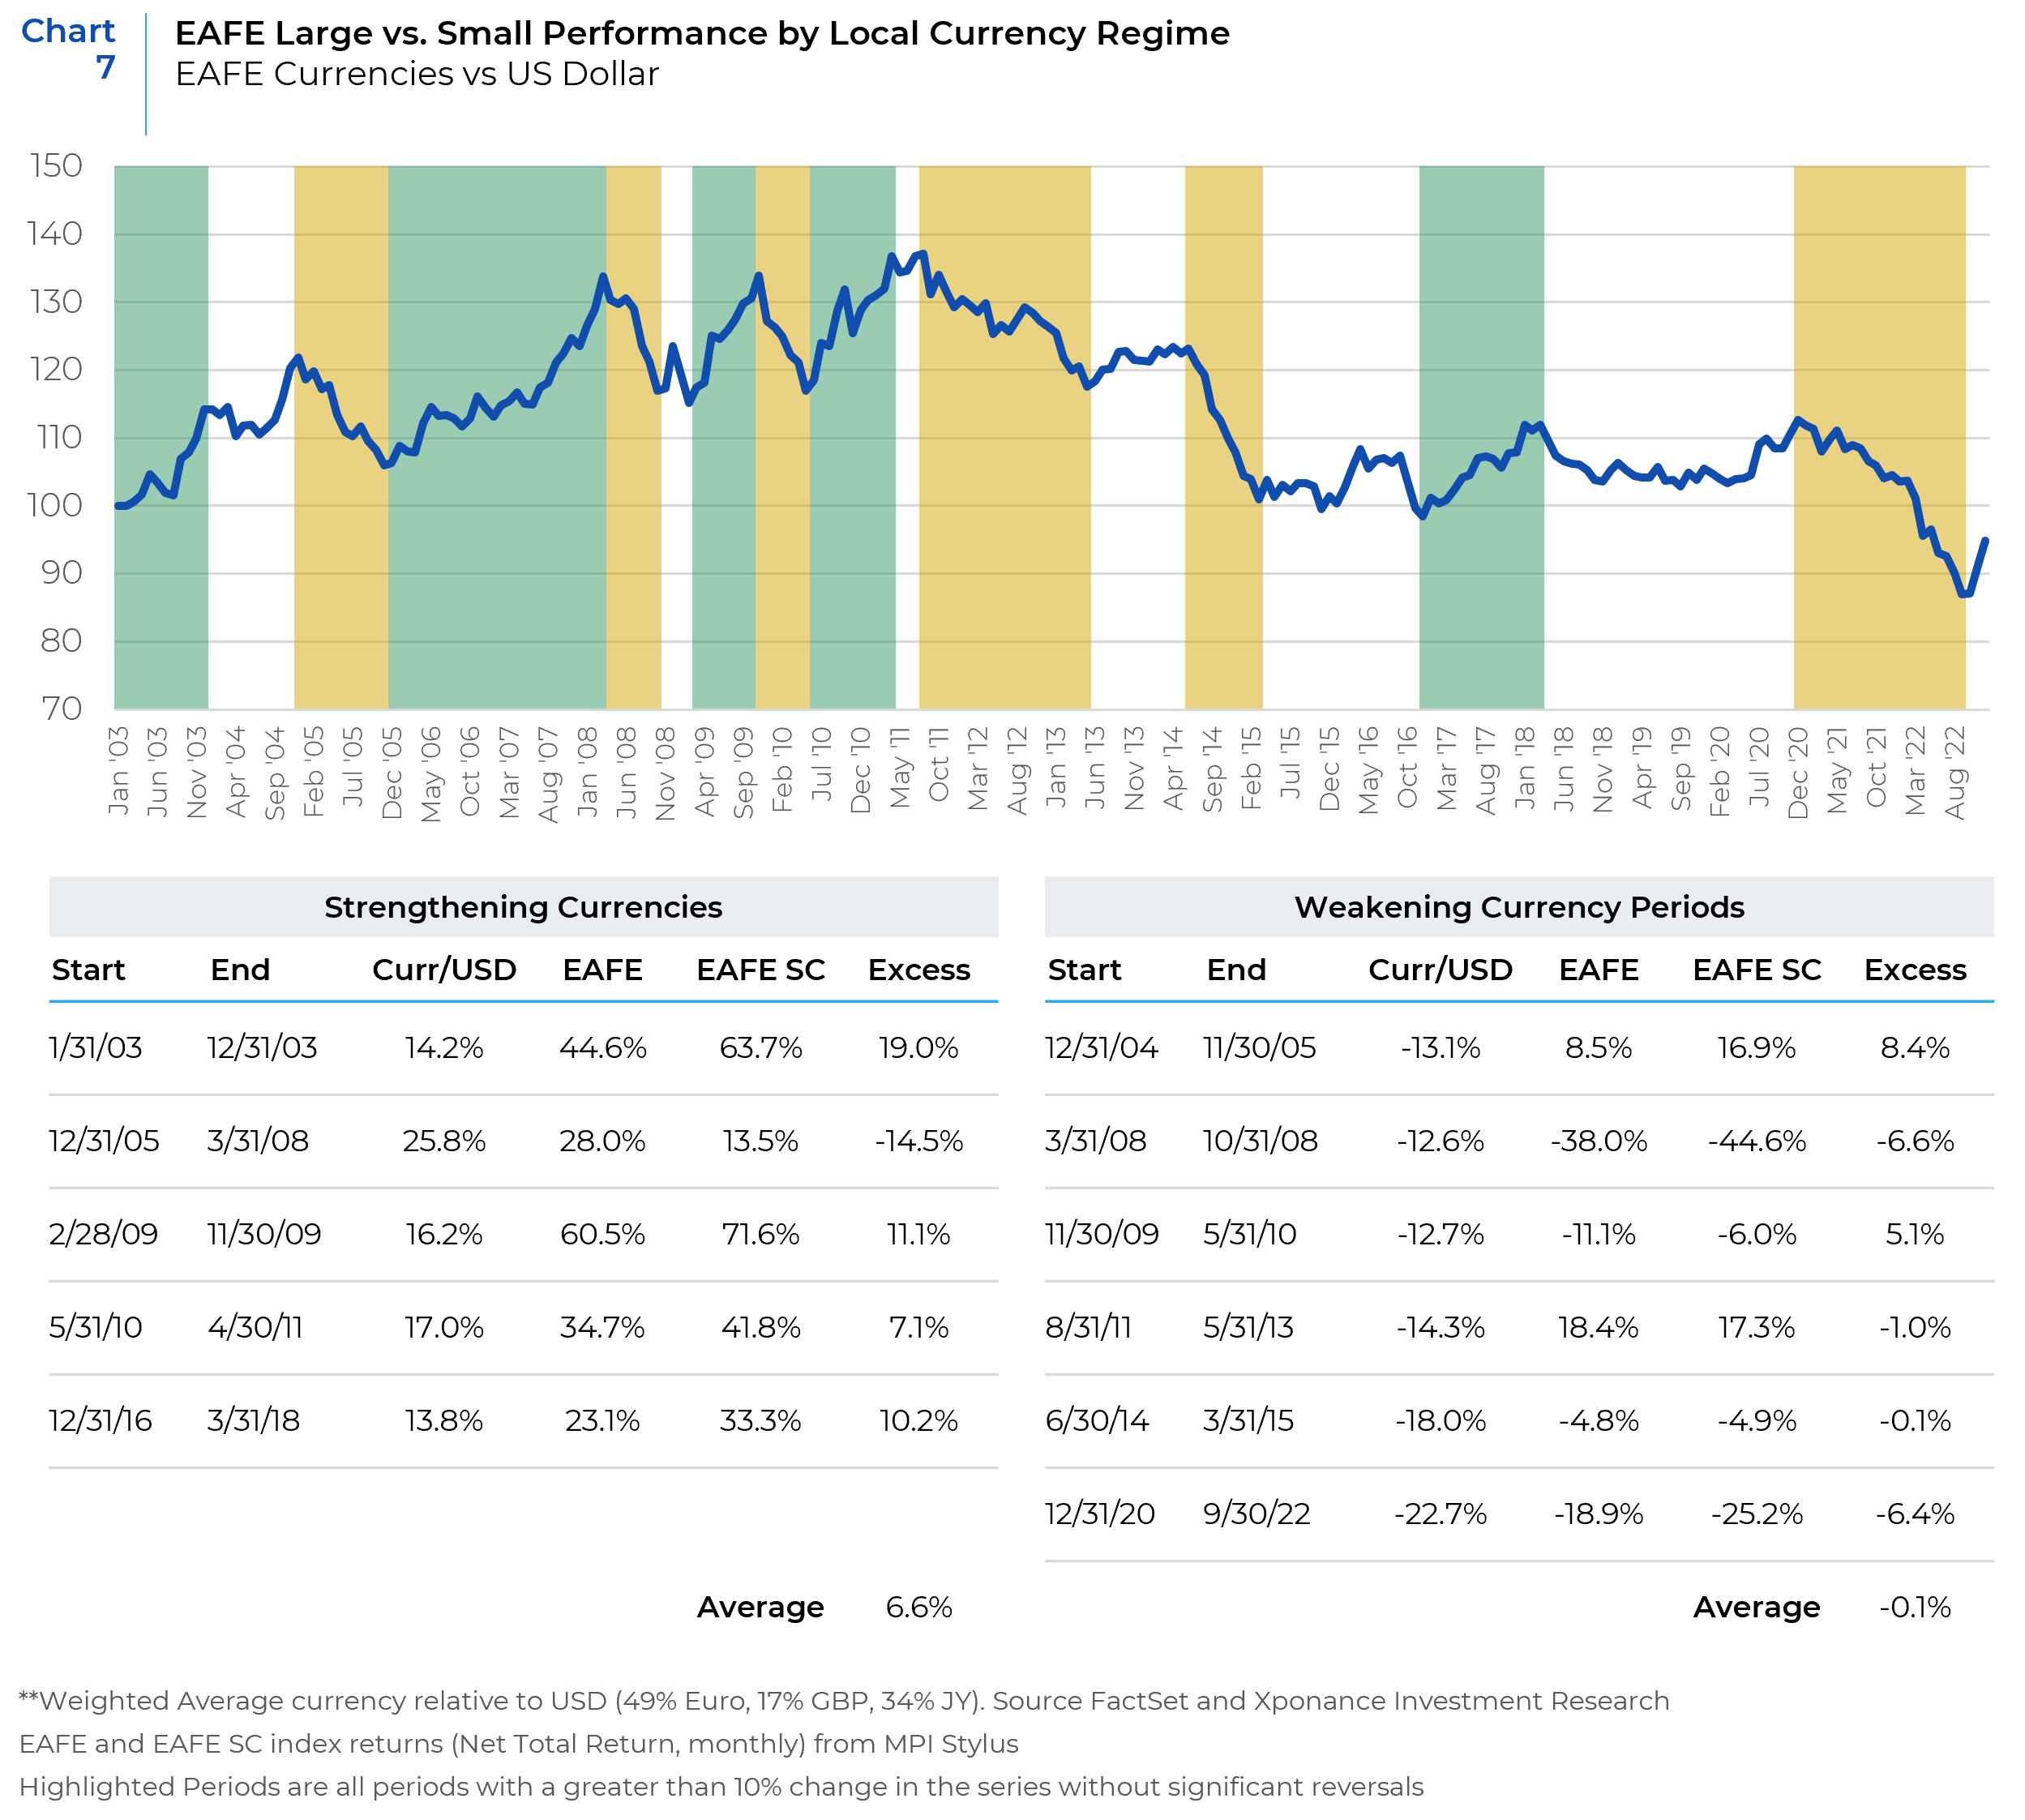
Due to their more significant dependence on foreign revenue, we expect large-cap stocks to underperform during periods of strengthening local currencies. The thesis is straightforward: currency appreciation makes exports less competitive in foreign markets, impacting large-caps more than small-caps. Historical analysis confirms our intuition (Chart 7). During Periods when a blend of the Euro, Yen, and Pound appreciated vs. the US Dollar, small-caps significantly outperformed. The inverse was true during periods of currency weakening. Should the recent trend of US Dollar weakness continue, we expect it to support the relative performance of small-caps.
Divergent Global Growth / China Stimulus
As shown above (Chart 4), the underlying geographic revenue exposure of small-caps is materially lower than for large-caps. Large-caps have almost twice the revenue exposure to the U.S. (19% vs 9%) and China (8.1% vs 4.8%) than small-caps. With the U.S. facing serious inflationary forces (for more refer to our global outlook), but China opening up from pandemic restrictions and possibly looking toward further stimulus, these exposures may ultimately counterbalance each other in the short-run.
Energy Security, ESG, etc
In ESG investing, and especially sustainability or climate conscious investing, companies that disclose their environmental footprint as well as plan towards achieving carbon neutrality will likely be favored by European allocators. On disclosure, large-cap stocks have been the leaders to date, taking advantage of their greater economies of scale to absorb the cost burdens of collecting and reporting critical environmental data. This has left small caps disproportionately excluded from most screens or mandates, merely due to the lack of reporting. But the evidence suggests small-caps are gradually catching up and from current levels have far more upside than large caps. Specifically, within the EAFE index, 90% of the index constituents have already reported some level of environmental data , whereas only 63% of the companies in the EAFE small cap index have reported environmental data. Going forward, additional reporting by small cap companies will disproportionately facilitate their inclusion in the data-based rankings, indices, ETFs, and research screens that require or favor such disclosures.
The second part of benefiting from investor preferences for ESG or sustainability themed mandates is to have the newly disclosed data be favorable to your firm. In this regard, small caps face competing factors. On the one hand, the sector weights of small caps, especially more exposure to industrials vs health care, would tend to suggest that small cap portfolios would on average be more resource intensive. However, this would just be at the direct level of resource utilization, otherwise known as Scope 1 and 2 emissions. Scope 3 emissions, which are a company’s indirect emissions, encompass distribution, transportation, and business travel, and as a result of their expansive definition tend to be the largest source of emissions for most firms outside of the utilities, energy, and materials sectors. The utilization of Scope 3 emissions, would tend to favor small caps, with less globalized distribution and business networks. The leading environmental data aggregators such as Sustainalytics and MSCI prefer to use all three levels of emissions reporting wherever possible.
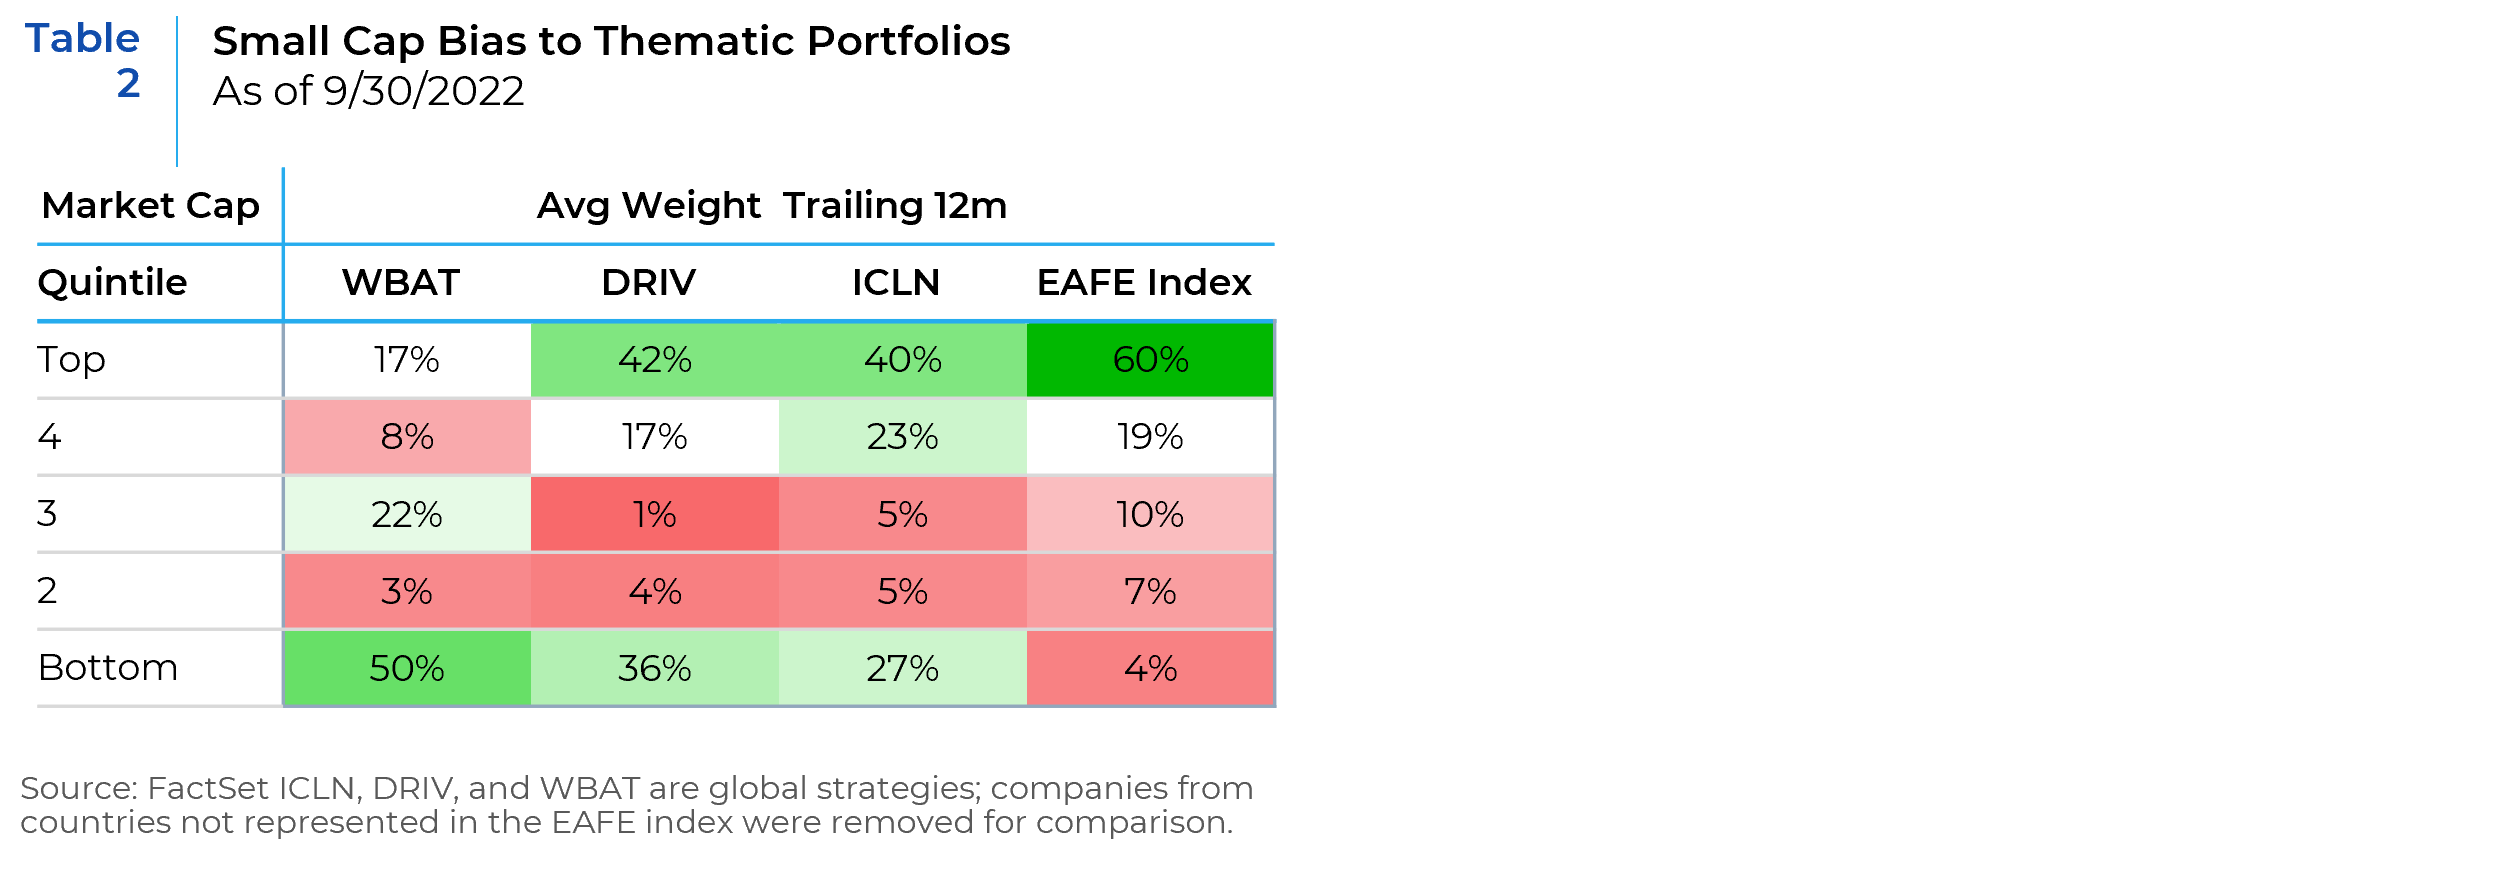
There is some evidence that small caps may benefit disproportionately from current thematic investing trends aligned with climate change and clean energy transition. The charts below compare the weight allocated to small-cap holdings in the EAFE index and three niche thematic ETFs, including two of the largest in the U.S. by assets: WisdomTree Battery Value Chain and Innovation (WBAT), Global Autonomous & Electric Vehicle (DRIV), and Global Clean Energy (ICLN).
All three of these ETFs’ international holdings have substantially more exposure to small caps than the EAFE index. Insofar as these ETFs represent the opportunity set available to thematic investors, their larger exposure to small-caps compared to the core index indicates that further allocations to these themes at the expense of passive or other cap-weighted allocations could be a further tailwind to small caps.
Below are some takeaways from some of our international boutique managers.
What is your outlook for International Large vs. Small Cap?
Lizard Investors – Based in Chicago, IL
Large caps outperformed meaningfully this year as small caps faced challenges with liquidity. The USD has begun to roll over, which we think is a healthy thing. This may be the start of longer-term weakness in the USD, which we believe would be very bullish for non-US small caps over a multi-year period. Predicting the timing is tough, but at some point, we accept that international small cap is poised to have a very meaningful move to the upside. We may have to wait a few more quarters.
What was/is the relative impact of China’s policies on Small Cap relative to Large Cap?
Frontier Global Partners – Based in La Jolla, CA
Frontier Global Partners – The COVID shutdowns in China and Russian sanctions (resulting in the closing of operations in Russia) both affected large companies more than small companies, as might be expected. But again, there is wide variance by sector as the loss of Chinese and Russian consumers is very different than losing China or Russia as a supplier; the former impacted revenue and the latter created inflation in the supply chain.
Spot oil and gas prices are uniform worldwide, so large and small producers in this sector benefitted commensurately. On the other hand, electricity prices vary widely by regions due to local power sources and by country due to differing regulatory schemes. Regulation provides for stable electricity prices provided there are reliable sources of electricity generation inputs. And, in general, large companies can negotiate lower electricity prices.
What was/is the impact of Russian sanctions, energy prices on Large Cap vs Small Cap?
ARGA Investment Management – Based in Stamford, CT
With respect to Energy prices, we believe the European market (and hence EAFE vs. EAFE SC) has more near term exposure given the high natural gas prices there and the dependence of European industry on that commodity. This is a direct consequence of Russia’s geopolitical issues, and the curtailment of pipeline supplies to Europe from Gazprom. While Europe has worked to offset this shortfall by importing more LNG, practically all the LNG has been at very high spot prices (much higher than contractual LNG prices or Gazprom pipeline gas prices). While higher LNG prices have a negative impact on Japan (higher weight in EAFE SC), most Japanese supply is at contractual prices – significantly below spot prices, and they have not had to find substitutes for cheaper previous pipeline gas as has Europe.
Over the longer term, we believe both regions have significant exposure to Energy; however, our normalized oil and gas forecasts (based on marginal cost) are below current prices and 2022 average prices. If Russian pipeline gas were ever to be restored to Europe, this would likely have a significant positive economic impact.
Actionable Takeaways & Summary
Developed international small-cap stocks are attractively valued by historical standards and the discount does not appear to be sufficiently justified by the sector exposure differences of the indices. If history is a guide, the current period represents a compelling time to increase exposure to smaller stocks relative to their larger counterparts. As with any valuation-based analysis, compressed multiples (or relative multiples in this case) impact the probability of positive outcomes over intermediate horizons and can not be used as a timing tool. On balance, we favor a modest overweight to small-cap stocks within an international allocation.
Near-term tailwinds for small-cap relative to large-cap
- Pro-cyclical sector positioning will benefit small-caps more in an economic recovery in EAFE markets.
- Stabilizing or falling energy costs and lower structural inflation in Europe and Japan should disproportionately benefit small-caps. This will directly benefit the margins of companies as well as cap the level of interest rates in these markets (higher rates benefit the sector positioning of large caps).
Headwinds for small-cap relative to large-cap
- Stronger US growth and or Chinese stimulus would disproportionately benefit the global revenue profile of Large-Caps.
- Sector differences would benefit large caps over small caps as real rates rise, but may be moot if rates only rise in nominal terms.
1 For the remainder of this report, “large cap” is meant to refer to the MSCI EAFE index and “large caps” to its constituent companies. “Small cap” refers to the MSCI EAFE Small Cap Index and “small caps” to its constituent companies.
This report is neither an offer to sell nor a solicitation to invest in any product offered by Xponance® and should not be considered as investment advice. This report was prepared for clients and prospective clients of Xponance® and is intended to be used solely by such clients and prospects for educational and illustrative purposes. The information contained herein is proprietary to Xponance® and may not be duplicated or used for any purpose other than the educational purpose for which it has been provided. Any unauthorized use, duplication or disclosure of this report is strictly prohibited.
This report is based on information believed to be correct, but is subject to revision. Although the information provided herein has been obtained from sources which Xponance® believes to be reliable, Xponance® does not guarantee its accuracy, and such information may be incomplete or condensed. Additional information is available from Xponance® upon request. All performance and other projections are historical and do not guarantee future performance. No assurance can be given that any particular investment objective or strategy will be achieved at a given time and actual investment results may vary over any given time.

