
Here’s a breakdown of recent developments:
- Credit Spreads and Fixed Income Markets:
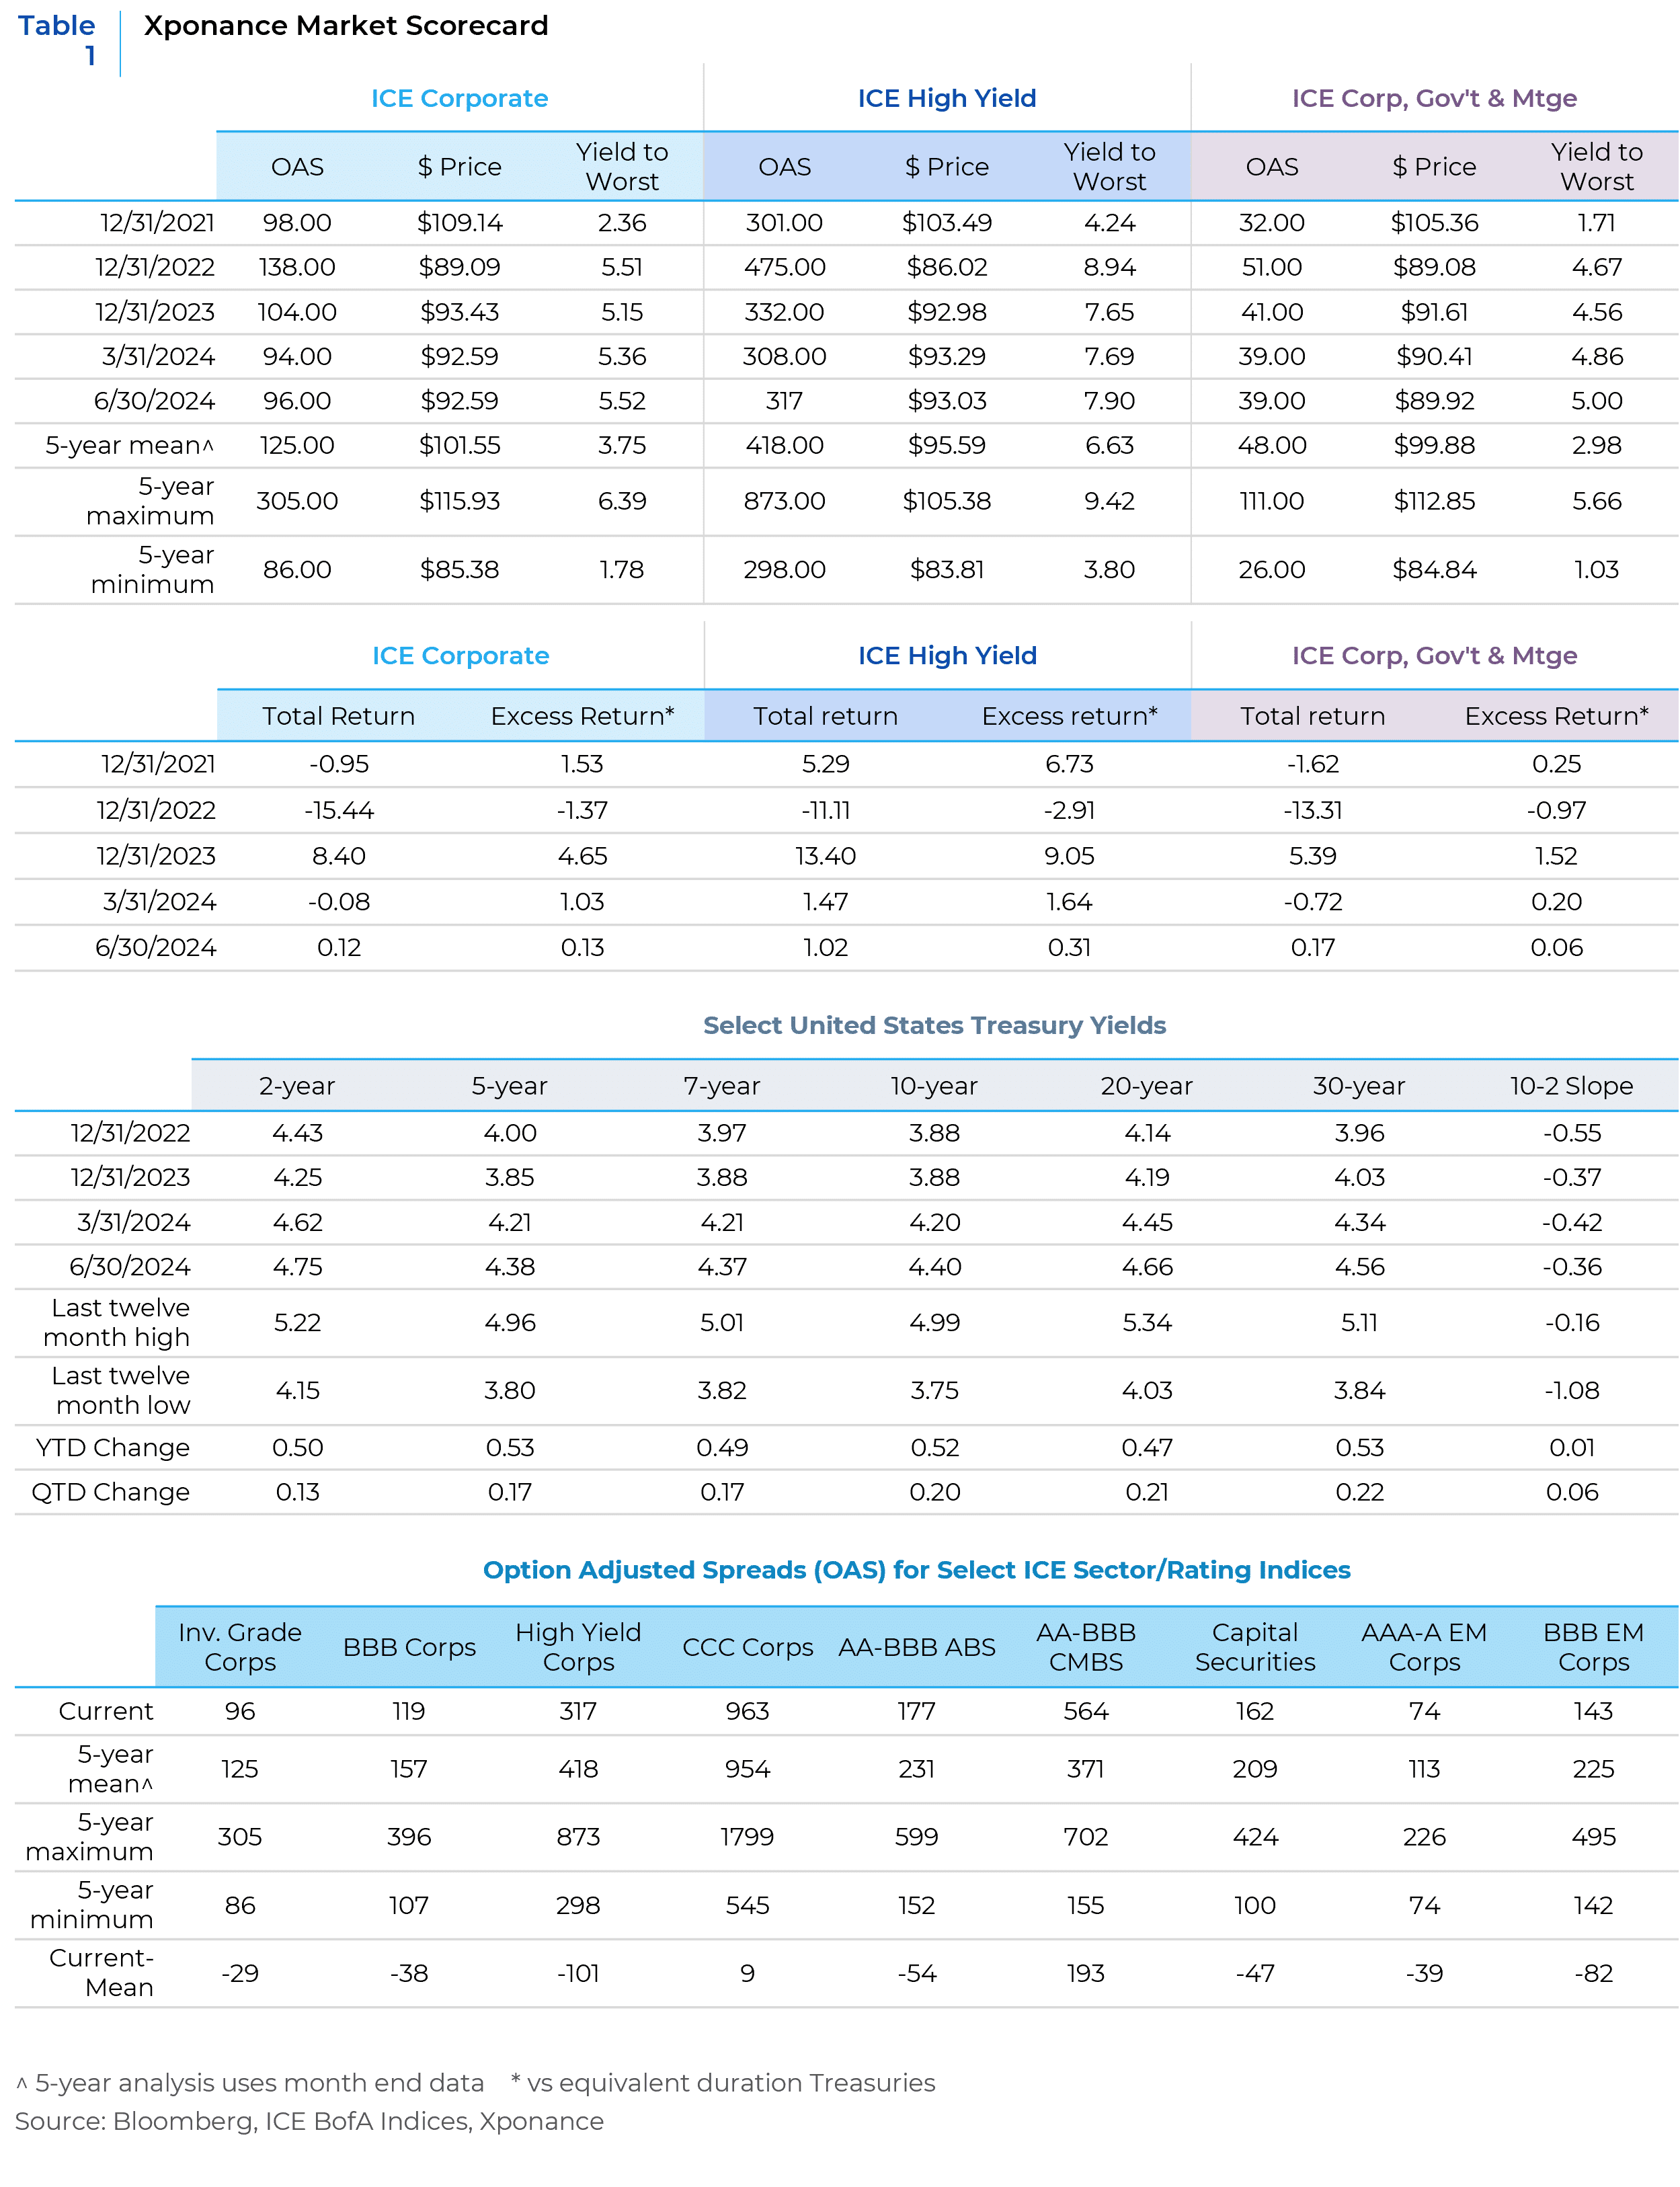
- Investment grade credit spreads widened in June, marking the first increase since October 2023 (see Table 1).
- High yield spreads, on the whole, saw minimal widening during the month, but CCC-rated spreads expanded by nearly 40 basis points.
- Commercial mortgage-backed securities (CMBS) spreads also widened throughout the second quarter, although they remain tighter than year-end levels.
- Positive Returns Amid Rising Yields:
- Despite upward movements in both Treasury yields and credit spreads, various components of the fixed income universe managed to achieve positive excess and total returns.
- The yield and spread breakeven calculations continue to favor fixed income investors, acting as a buffer against volatility—especially as we approach the U.S. presidential election.
- Deeper Analysis:
- Our customary examination of yield and spread break-evens spans multiple market sectors.
- We also highlight the concerning trend of declining fundamental credit quality, even amidst historically tight risk premia.
- The Elephant in the Room: U.S. Fiscal Policy:
- Growing discussions about the sustainability of U.S. fiscal policy prompt us to delve into the dynamics of U.S. debt.
- What implications might this have for the future trajectory of Treasury yields and their ripple effects on the broader economy?
- Charting the Course Ahead:
- Finally, we offer a blueprint for navigating the third quarter of 2024 and the remainder of the calendar year.
In this complex economic landscape, understanding these dynamics becomes crucial. As always, we keep a watchful eye on the numbers, the trends, and the underlying forces shaping our corner of the financial world.
Despite the recent widening in credit spreads over the past month and quarter, the market’s technicals and demand remain robust. In the first half of 2024, corporate bond issuance reached nearly $1.1 trillion. Approximately half of this issuance was related to refinancing maturing debt or strategically removing existing debt from circulation through repurchases, tenders, and calls.
Interestingly, foreign net purchases of United States corporate bonds hit a record high, as indicated by the US Treasury International Capital Statistics data. Additionally, investment grade corporate bond exchange-traded funds (ETFs) are experiencing strong inflows, while short interest in the most liquid corporate ETFs has simultaneously decreased.
The New York Federal Reserve compiles a corporate market distress indicator that assesses distress levels in both the primary and secondary US corporate bond markets. Remarkably, this indicator remains near all-time lows since its inception in 2005.
That’s where it gets intriguing: Despite credit spreads staying below 100 basis points (bps), US corporate yields are higher than most other industrialized countries. This paradoxical situation makes sense when you consider the broader context.
However, we should tread carefully. While the technical backdrop appears strong, there’s a potential pitfall: The weakening macroeconomic landscape. As the overall economic picture continues to lose some luster, we might find ourselves facing market disappointment.
For instance, the widening spreads in both credit commercial mortgage-backed securities (CMBS) and CCC-rated high yield bonds serve as a stark reminder that fundamentals can clash with positive demand and sentiment. In this tug-of-war between financial forces— fundamentals will ultimately trounce sentiment.
As highlighted in our introduction, the current yield levels and bond mathematics present a compelling argument for maintaining investments in fixed income across the board, with a particular focus on the spread sectors. To put it simply, for these fixed income segments to significantly underperform over a 12-month horizon, we’d need a substantial upward movement in yields—whether driven by interest rates or spreads (see Table 2 below).
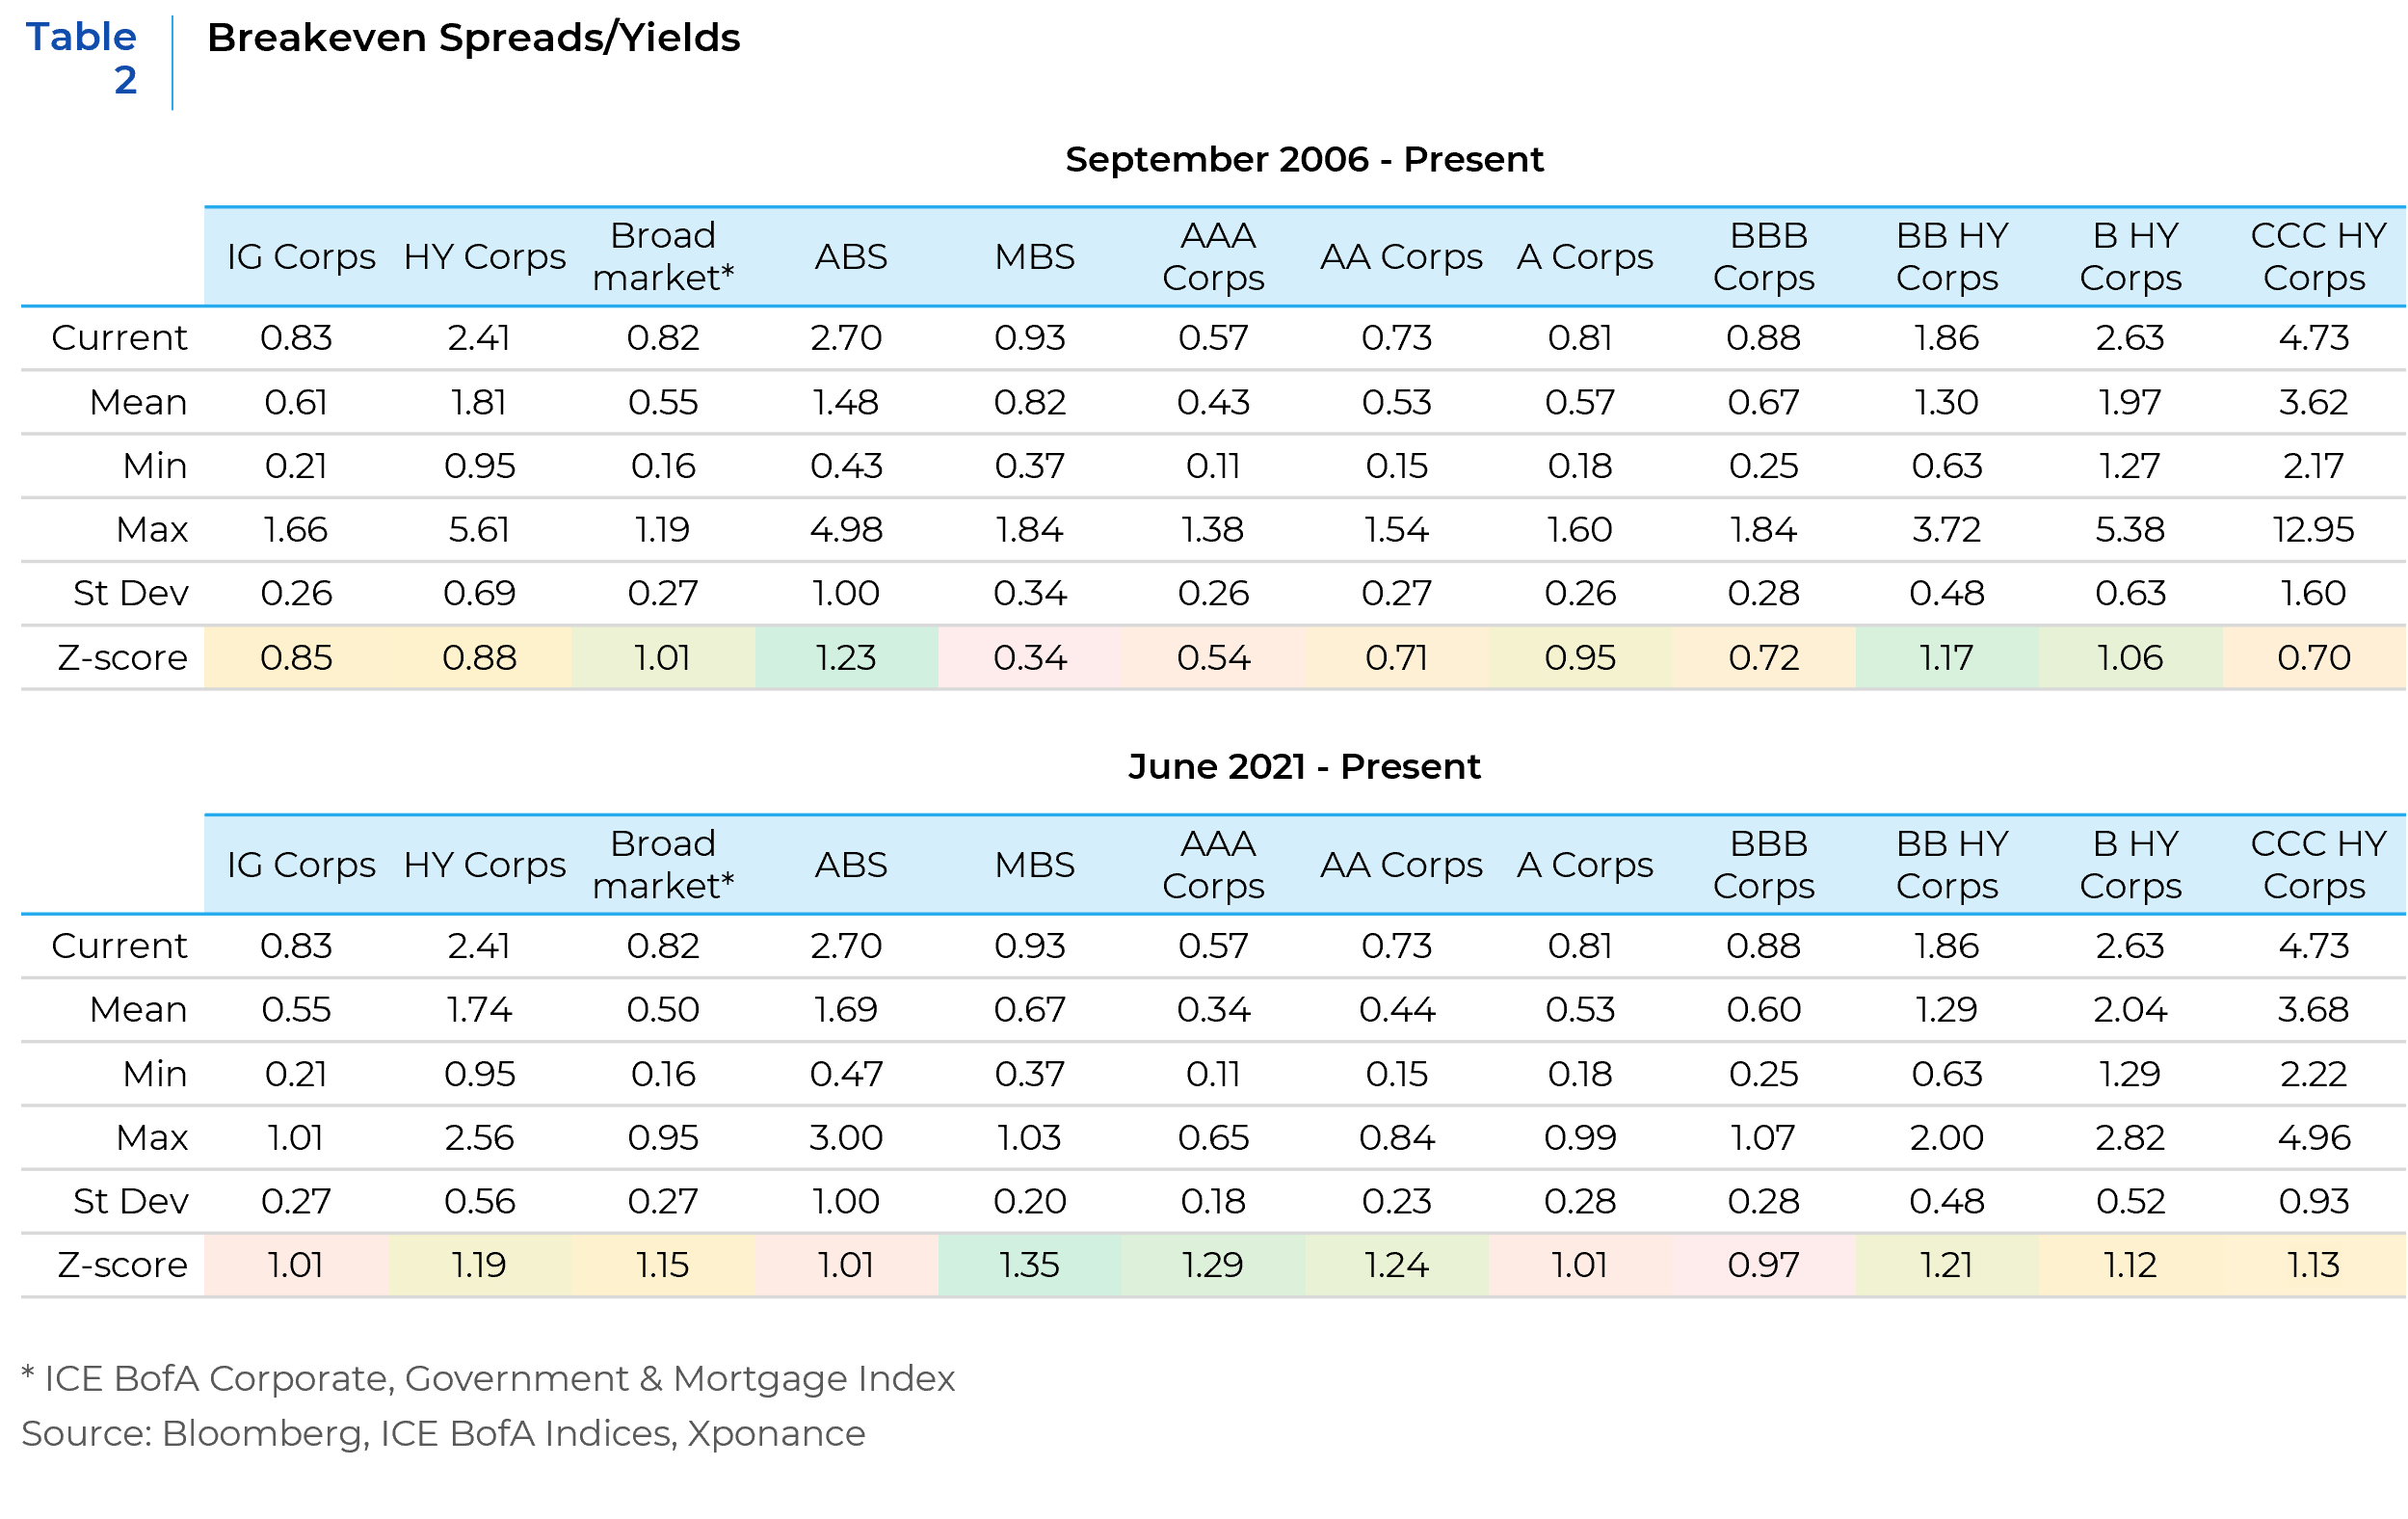
Interestingly, these metrics not only hold up well from a long-term perspective but also look even better when we examine the most recent 3-year period. This timeframe encapsulates the entirety of the post-COVID and post-Fed tightening era—a period that has seen its fair share of financial twists and turns.
When we examine broad credit quality metrics across various corporate sectors, the trend is unequivocally negative. Based on Bloomberg Intelligence data sourced from SEC filings, we observe a consistent rise in leverage over six consecutive quarters. Additionally, interest coverage and free cash flow generation—when compared to debt burdens—have both dipped below long-term averages.
While we await second-quarter 2024 data, there’s little reason to believe that the trajectory will change, as higher interest burdens and weakening top-line growth persist across many economic sectors.
Now, let’s talk defaults: Although they’ve slowed among high yield issuers and remain historically low, Chapter 11 bankruptcy filings in the broader economy (as reported on uscourts.gov) have reached their highest level in the past decade—excluding the pandemic-induced surge in 2020.
Curiously, despite this sobering data, spreads have tightened. Over the same six-quarter period, investment-grade spreads are now 42 basis points narrower, and high-yield spreads have contracted by a whopping 158 basis points. To be fair, the conclusion of the Federal Open Market Committee’s tightening cycle and the technical factors we previously discussed played a significant role in this movement tighter. However, current spread levels are clearly fragile.
As we consider the outlook for fixed income over the remainder of the year, we find ourselves at the uncomfortable intersection of fiscal and monetary policy against what appears to be a late-cycle economic expansion. The monetary policy trajectory is arguably clearer than it has been for much of the past year. And incoming economic data suggests we are indeed nearing the end of the business cycle. This leaves the fiscal condition of the US as a point of analysis.
Unfortunately, no matter which party wins in November, the fiscal situation will likely continue to worsen given each party’s policy priorities are expensive and unfunded. To put things in perspective, the U.S. government has consistently run budget deficits since the last surplus in 2001. These deficits and the associated concerns are not new phenomena. However, given the heightened interest in this topic, we decided to delve into an analysis of various aspects related to Treasury issuance.
One significant concern is the potential crowding out effect. As interest payments on the national debt continue to rise, there’s a risk that other essential government expenditures could be squeezed out. Data from the U.S Treasury show the discretionary portion of the federal budget is roughly one-third of the total ($1.7 trillion on a 2023 budget of $4.81 trillion). In fiscal 2023, the interest expense itself was $658 billion (and contained within the non-discretionary portion of the budget). Historically, crowding out has not been a major worry due to declining yields over the past four decades. But let’s explore this further.
A useful shortcut for assessing this issue is to compare the yield on the Treasury index (which reflects market interest rates) with the coupon rate on Treasury bonds (representing the interest paid on existing debt). Notably, newly issued Treasury coupon notes and bonds (distinct from short-term bills, which are issued at a discount) now carry coupon rates higher than both the aggregate coupon level and legacy bond issues that are maturing. This discrepancy is expressed as a ratio—the coupon-to-yield ratio. Currently, that ratio stands at 0.62, higher than the previous low of 0.46 but still well below the long-term average, which has typically been above 1. A ratio above 1 suggests declining interest rates, while below 1 indicates the opposite.
Keep in mind that existing debt only resets to market rates when it’s refinanced. Approximately 17% of the ICE BofA Treasury index (equivalent to about $2.92 trillion) matures within the next two years, with another 10% maturing in each of years 3 to 5. Additionally, the ICE BofA Treasury bill index—currently just under $4 trillion—may require longer-term issuance in the coupon market, especially as bill rates decrease alongside the Federal Funds target rate.
Given that deficits are running at around 5% of GDP, the need for both bill and coupon issuance will extend beyond merely refinancing maturing debt. Even at present levels, interest payments on Treasury debt relative to GDP have reached an all-time high, and our analysis suggests this trend will persist.
With the dollar as the global reserve currency and the Treasury market as the pinnacle of safety and liquidity, the United States stands on solid ground. A Treasury market meltdown due solely to weakening fiscal fundamentals seems unlikely. However, let’s delve into a comparative analysis.
- Comparing Debt-to-GDP Ratios and Credit Default Swap (CDS) Spreads:
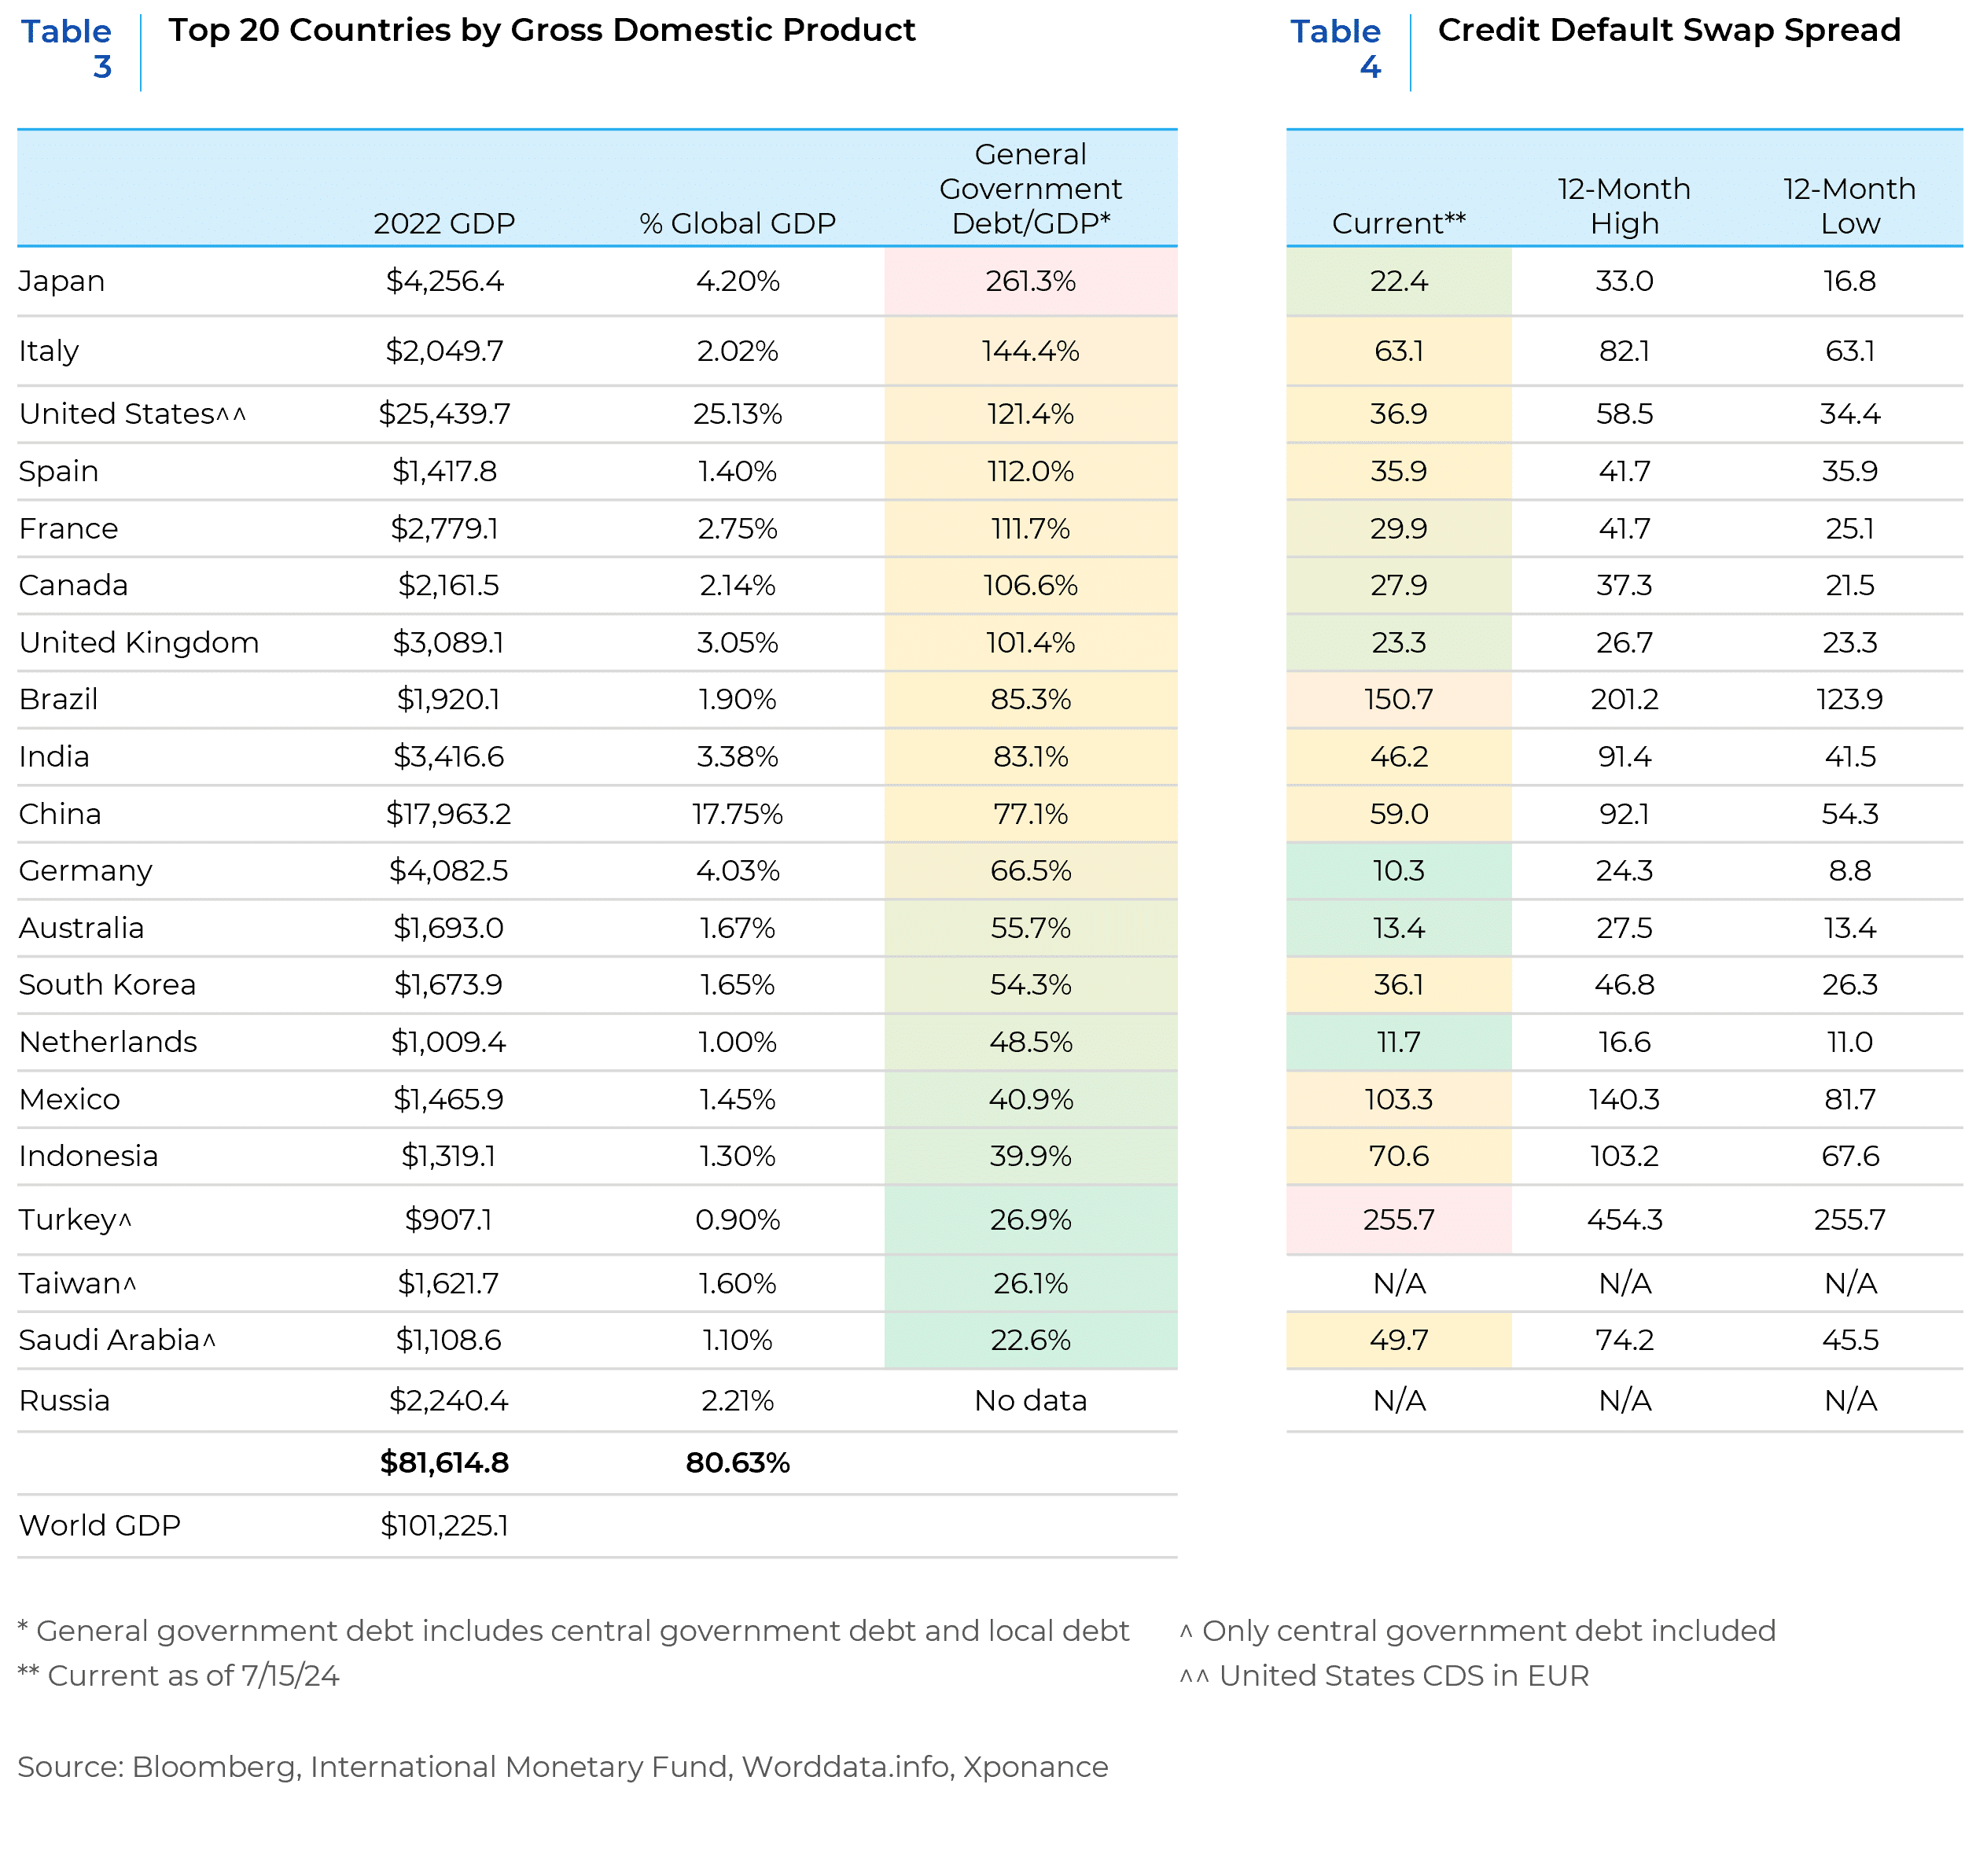
- We examined the Top 20 economies globally based on their debt-to-GDP ratios alongside CDS spreads. What insights could be gleaned from this exercise?
- Notably, the U.S. CDS spread reached an all-time high in 2023, driven by persistent downward pressure on the country’s credit ratings. What does this portend for Treasury yields going forward?
- Interestingly, even countries perceived to be in the debt/GDP danger zone—such as Italy—do not exhibit particularly alarming CDS spreads.
- The Pandemic’s Impact on Credit Metrics:
- The pandemic-induced economic turbulence has significantly affected country-level credit metrics worldwide.
- It will be intriguing to observe how CDS spreads and fiscal conditions evolve for various countries, especially given the prevailing downward trend in credit quality against the backdrop of potentially recessionary conditions.
Against the market themes discussed above, how do we position core fixed income portfolios? The landscape is peppered with exogenous risks—the looming US election and the fog of macroeconomic uncertainty. We expect volatility could spike as we move closer to Election Day. But here’s a gentle reminder: Economic cycles and political dramas don’t usually move in sync.
Now, let’s talk trades. Against this backdrop, we consider the following moves:
- Curve Steepeners: Imagine a financial seesaw. We’ve been noting this during the extended Treasury curve inversion phase. Portfolios should be positioned in the sweet spot—the belly of both the Treasury curve and corporate spread curves to reap the benefits of yield without undue exposure to the longest duration bonds. It’s finding that perfect balance point where yield differentials sway in your favor.
- Bond Choice: Within an issuer’s capital structure or a sector’s available securities, you have choices. Some bonds have wide spreads but uncertain near-term prospects. Others—lower dollar, higher convexity—can reduce the impact of a basis point move on the price of the bond. It’s about striking a balance between current income and downside protection.
- Quality Uplift: Current credit spreads do not distinguish between volatile issues, and market participants seem fine with this level of complacency. Financial performance matters, even if market participants are not pricing it as if it does. We seek out issuers with stable credit metrics without reaching for spread at this point in the business cycle. We look for sectors with solid business prospects and financial stability, avoiding cyclical sectors and searching for durable business models. If the economic tide is no longer rising, it will not lift all boats.
- The case for MBS: Agency mortgage-backed securities (MBS) beckon from the shadows. Historically, they are reasonably cheap—especially as compared to other spread sectors in the index. And here is the twist: With non-bank lenders dominating the origination landscape and the entire coupon stack below par, prepayment behavior is uncertain but the overall technical and fundamental backdrop for agency MBS remains strong.
To paraphrase mathematician John Allen Paulos (who inspired the title of this piece), the only certainty is uncertainty. Despite our relative confidence that the end of “higher for longer” interest rates is approaching and that a presidential election will occur in November, the way in which an economic cycle ends is always a surprise. To that end, all we can do is prepare the portfolios and analyze the incoming data.
This report is neither an offer to sell nor a solicitation to invest in any product offered by Xponance® and should not be considered as investment advice. This report was prepared for clients and prospective clients of Xponance® and is intended to be used solely by such clients and prospective clients for educational and illustrative purposes. The information contained herein is proprietary to Xponance® and may not be duplicated or used for any purpose other than the educational purpose for which it has been provided. Any unauthorized use, duplication or disclosure of this report is strictly prohibited.
This report is based on information believed to be correct but is subject to revision. Although the information provided herein has been obtained from sources which Xponance® believes to be reliable, Xponance® does not guarantee its accuracy, and such information may be incomplete or condensed. Additional information is available from Xponance® upon request. All performance and other projections are historical and do not guarantee future performance. No assurance can be given that any particular investment objective or strategy will be achieved at a given time and actual investment results may vary over any given time.