Last quarter, we discussed expectations for the yield curve’s shape as the Federal Reserve began its current easing campaign with a 50-basis point move in September. The takeaways were simple: expectations for steepening in the yield curve were likely underpriced by both economic forecasts and market-based expectations. Since then, much has changed as we await a different policy regime. Our analysis of the yield curve last quarter and the subsequent developments in fixed income markets, both post-election and in the run-up to the event itself, paint a confusing picture of forward economic expectations. One point we have consistently made in our past commentaries is that “the market” continues to be wildly incorrect in consistently estimating the magnitude, timing, and number of interest rate moves by the Federal Open Market Committee (FOMC). We have taken this analysis a step further by examining bond market behavior and returns during each cycle of FOMC rate cuts since this became the Fed’s primary policy tool in 1982. We begin by recapping the significant changes in market price levels and expectations over the fourth quarter. Given the substantial price action in rate markets, we consider what outcomes the market is currently pricing, the risks to this “consensus” view, and what we think will or will not occur as the new administration begins its term.

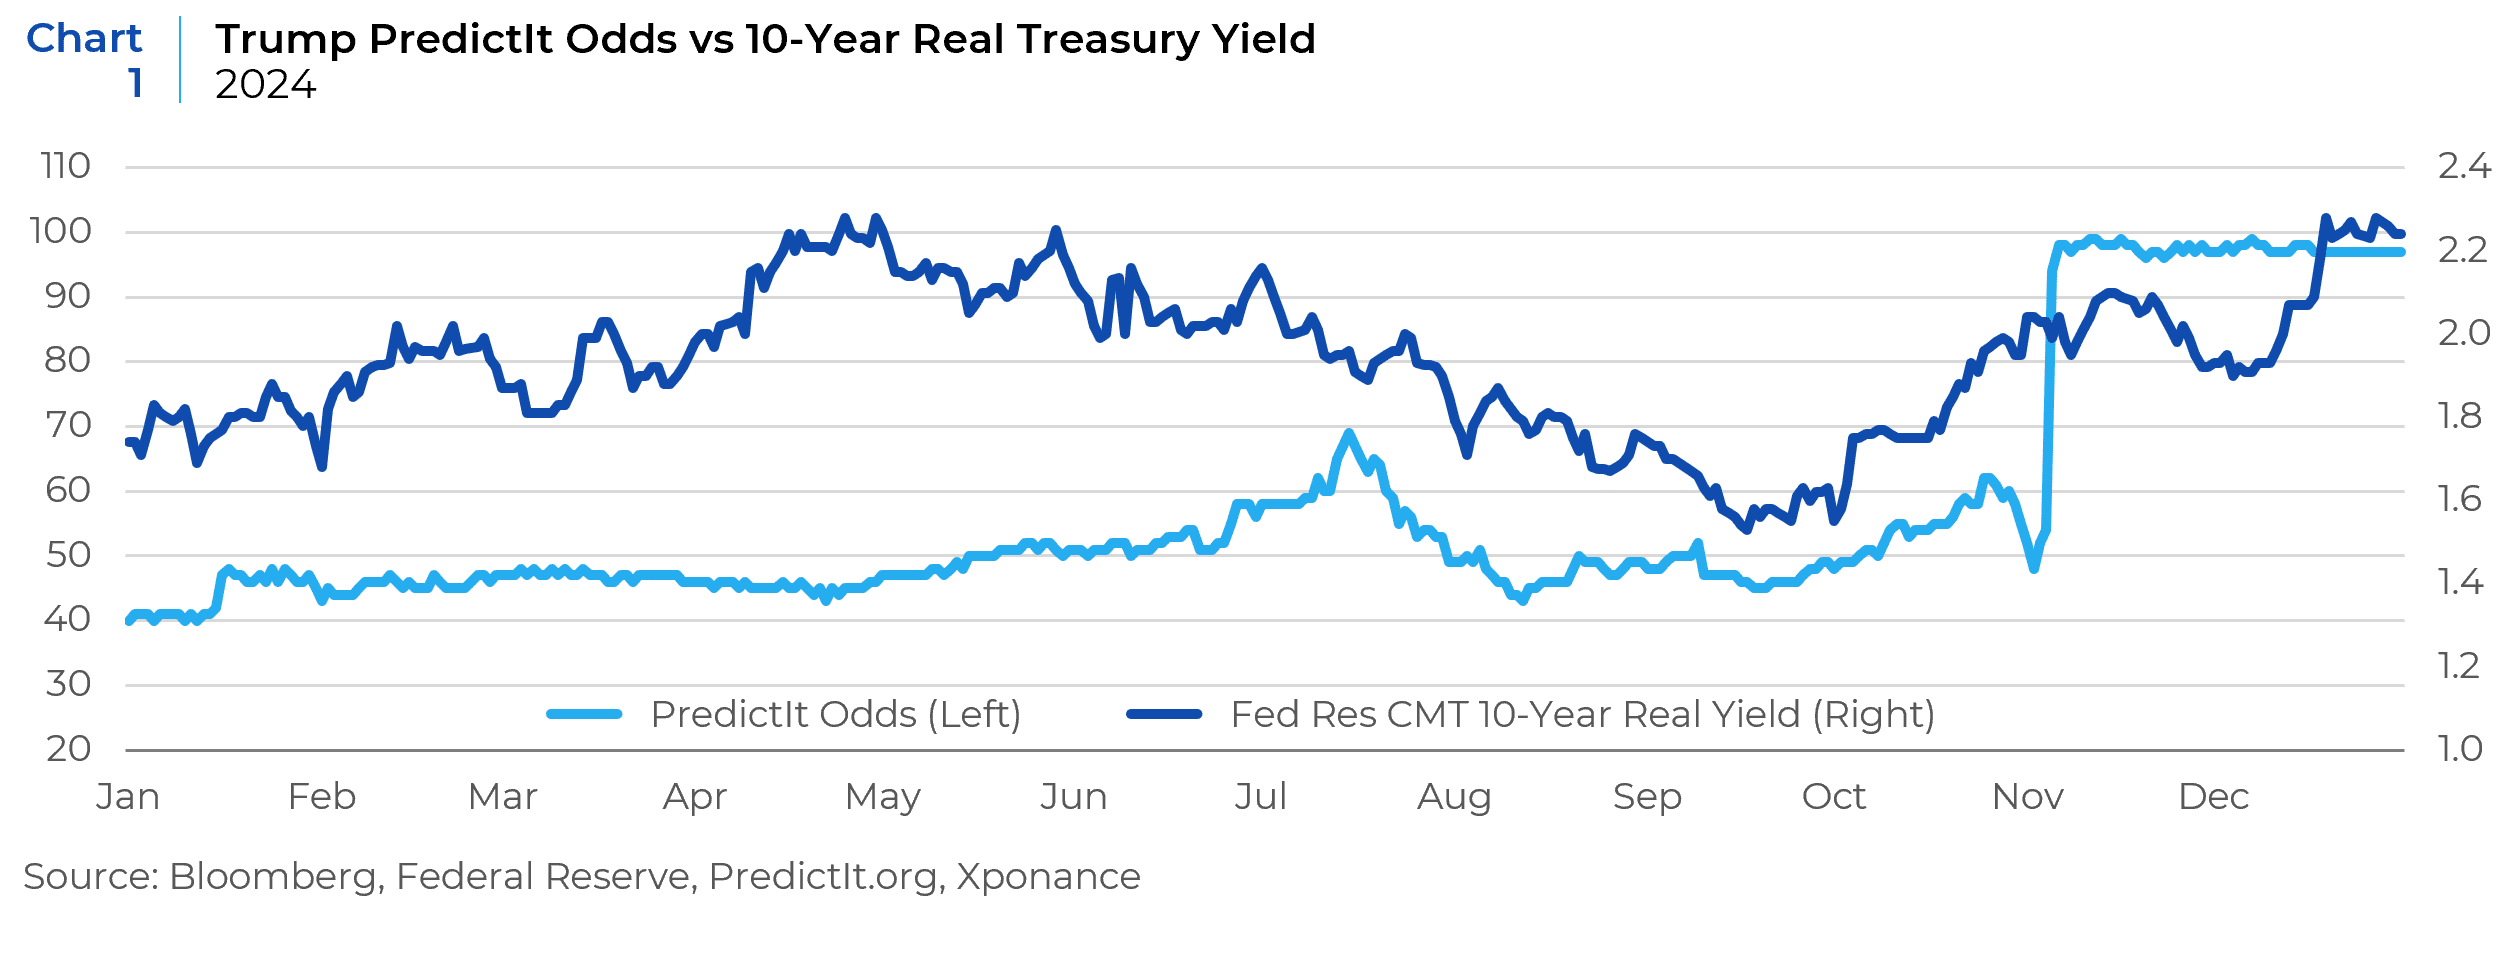
The fourth quarter of 2024 marked the only easing cycle in the post-Volcker period that began so close to an election. Moreover, markets perceived the post-election macroeconomic policy regime to have significantly divergent outcomes. As a result, we evaluated need only to look at betting market odds of a Trump victory and overlay interest rate moves to see how higher inflation and/or growth was anticipated by rates traders. At a high level, credit markets were not as sensitive to differences in these outcomes.
Since the beginning of the Fed easing campaign in September 2024, longer-term interest movements have been anomalous compared to historically typical easing cycle behavior. In Easing cycles are typically met with a bull steepening of the yield curve (rates moving down across the Treasury maturity curve, led by short-dated bonds). However, in the run-up to and immediately after the US presidential election, rates moved higher when the odds of a Trump presidency increased which led to this highly unusual bear steepener. This is anomalous relative to prior easing cycles since 1982, which was when the Federal Funds rate became the main policy management tool for the Fed.
Historically, 12 weeks out from the initial rate cut, the absolute level of the 10-year bond yield has been significantly lower. Notably, the only periods with similarly large increases in the 10-year bond yield post-Fed easing were after the beginning of the 1982 easing cycle, the 1998 rate cuts in response to emerging market stress (including the Long Term Capital debacle), and the current easing cycle. There is a clear analogy with the 1982 cycle, as both periods followed a painful inflationary cycle, leaving markets wary of a resurgence.
This feeds into the current market narrative about the return of the term premium. However, US futures are currently pricing only one further rate cut by mid-2025 and fewer than two full cuts by late 2026. Bloomberg consensus economic estimates anticipate a terminal Federal Funds rate of 3.5% (implying nearly a full percentage point of further reductions) by year-end 2026. Real yields (calculated using the TIPS/Nominal Treasury differential) increased significantly throughout the 4th quarter, validating the notion that the market is pricing both a higher growth/higher inflation economy but has not yet determined which is the greater threat to fixed income.

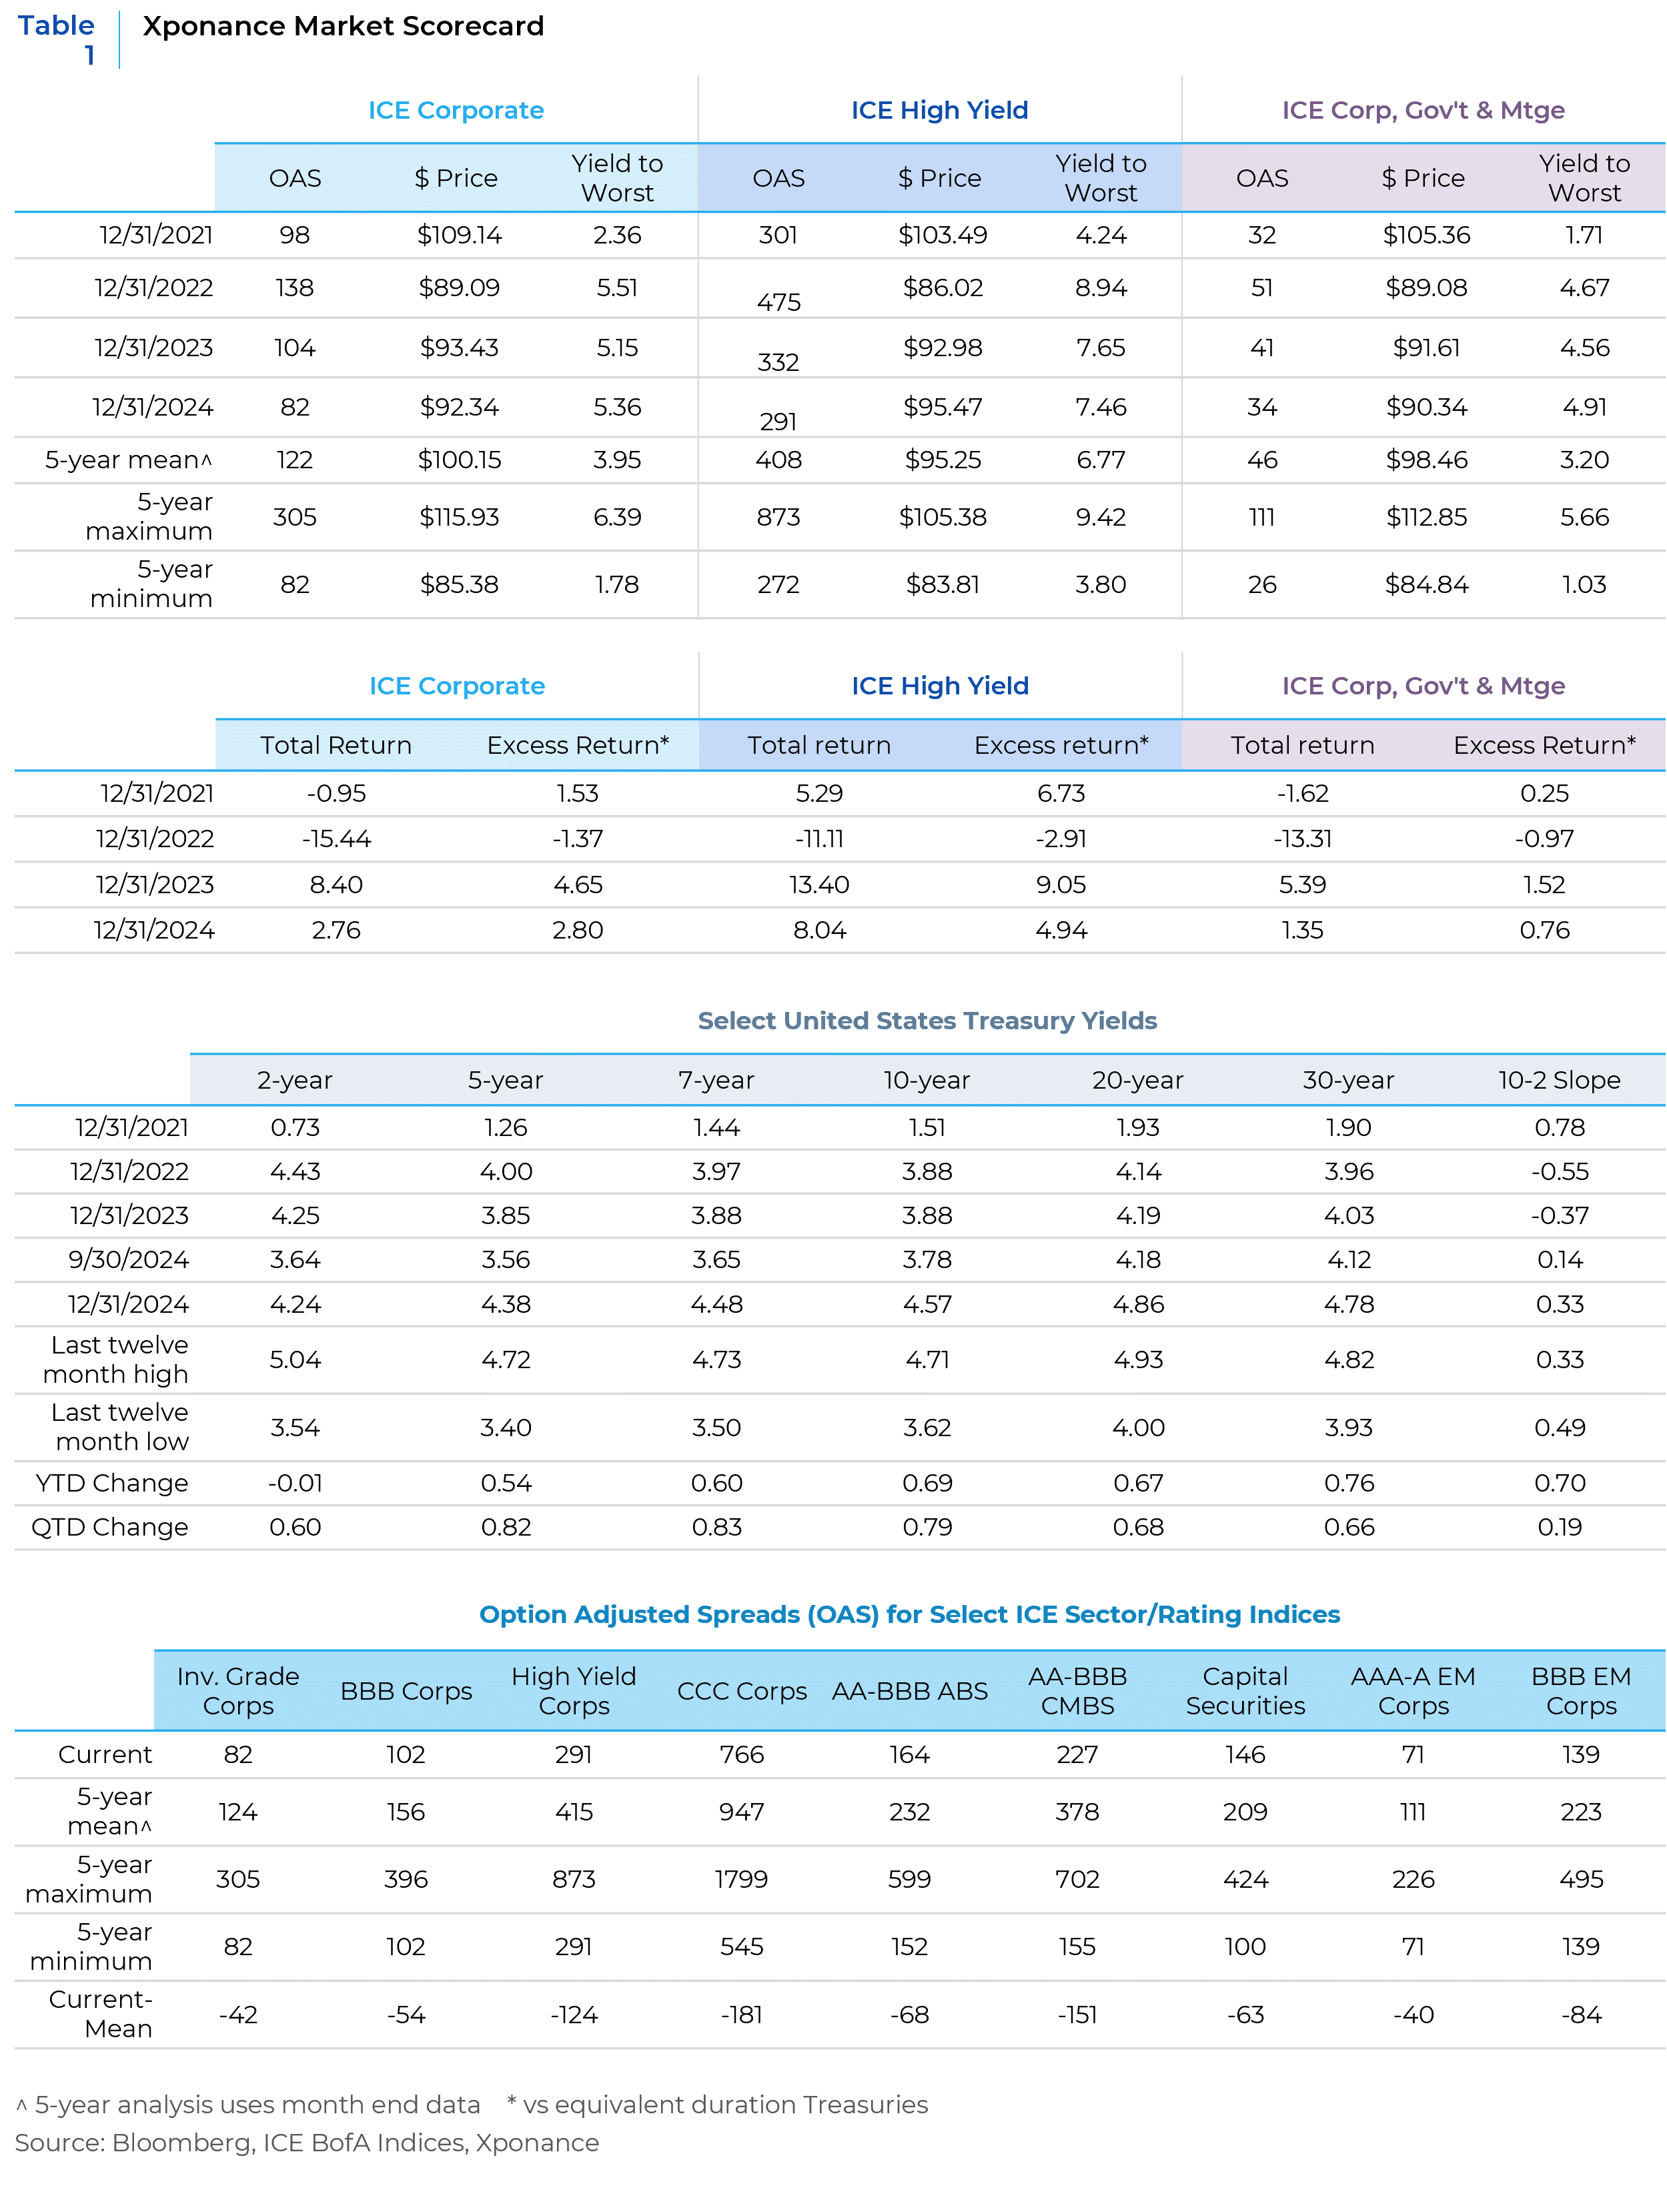
We discussed the relative unattractiveness of corporate bond spreads last quarter, but their valuation has not improved. When considering the absolute (historically tight) level of spreads against both interest rate and implied equity volatility, it appears that spreads are not accounting for the potential for higher absolute rates or an increase in rate volatility. Upward pressure on rate volatility would catalyze higher volatility in both the equity and fixed income spread markets. There has, however, also been strong technical demand for corporates, which is expected to continue this year, and serves to keep spreads tight and well behaved despite increasing risks among many corporate issuers. When we examine the corporate market from a broad sector perspective (financials, industrials, utilities), there is no clear reaction in the data as there has been in rates markets. In fact, financials traded better than broad corporates immediately after the election, but this effect faded as we moved through the quarter and into year-end.
Our view is that the market is directionally pricing in reasonable outcomes given the potential policy changes. However, at the beginning of 2024, the market was pricing in six or more rate cuts starting in March. As it turns out, the number of cuts was much fewer and started much later. Markets or market expectations overshooting reality is common, but what are the risks to current market-based expectations? One significant risk lies in the assumptions from the Congressional Budget Office and market participants’ expectations for the fiscal health of the United States. We discussed this at length last year (2Q24 Fixed Income update), but the debt trajectory is universally considered dangerous for financial markets and the budgetary needs of the country moving forward. This could lead to a much steeper Treasury curve and much higher long-term rates than many market participants have experienced in their careers.
Stagflation is another outcome not currently considered in market-based measures. Economic data has broadly moderated (economic surprise indices have recently dipped), yet the labor market remains reasonably robust. More importantly, inflation appears to have firmed (or in some cases, potentially reemerged). We think this means that interest rate option markets are pricing in the fact that rates could move either up or down depending on near- and intermediate-term data and the trends that emerge.

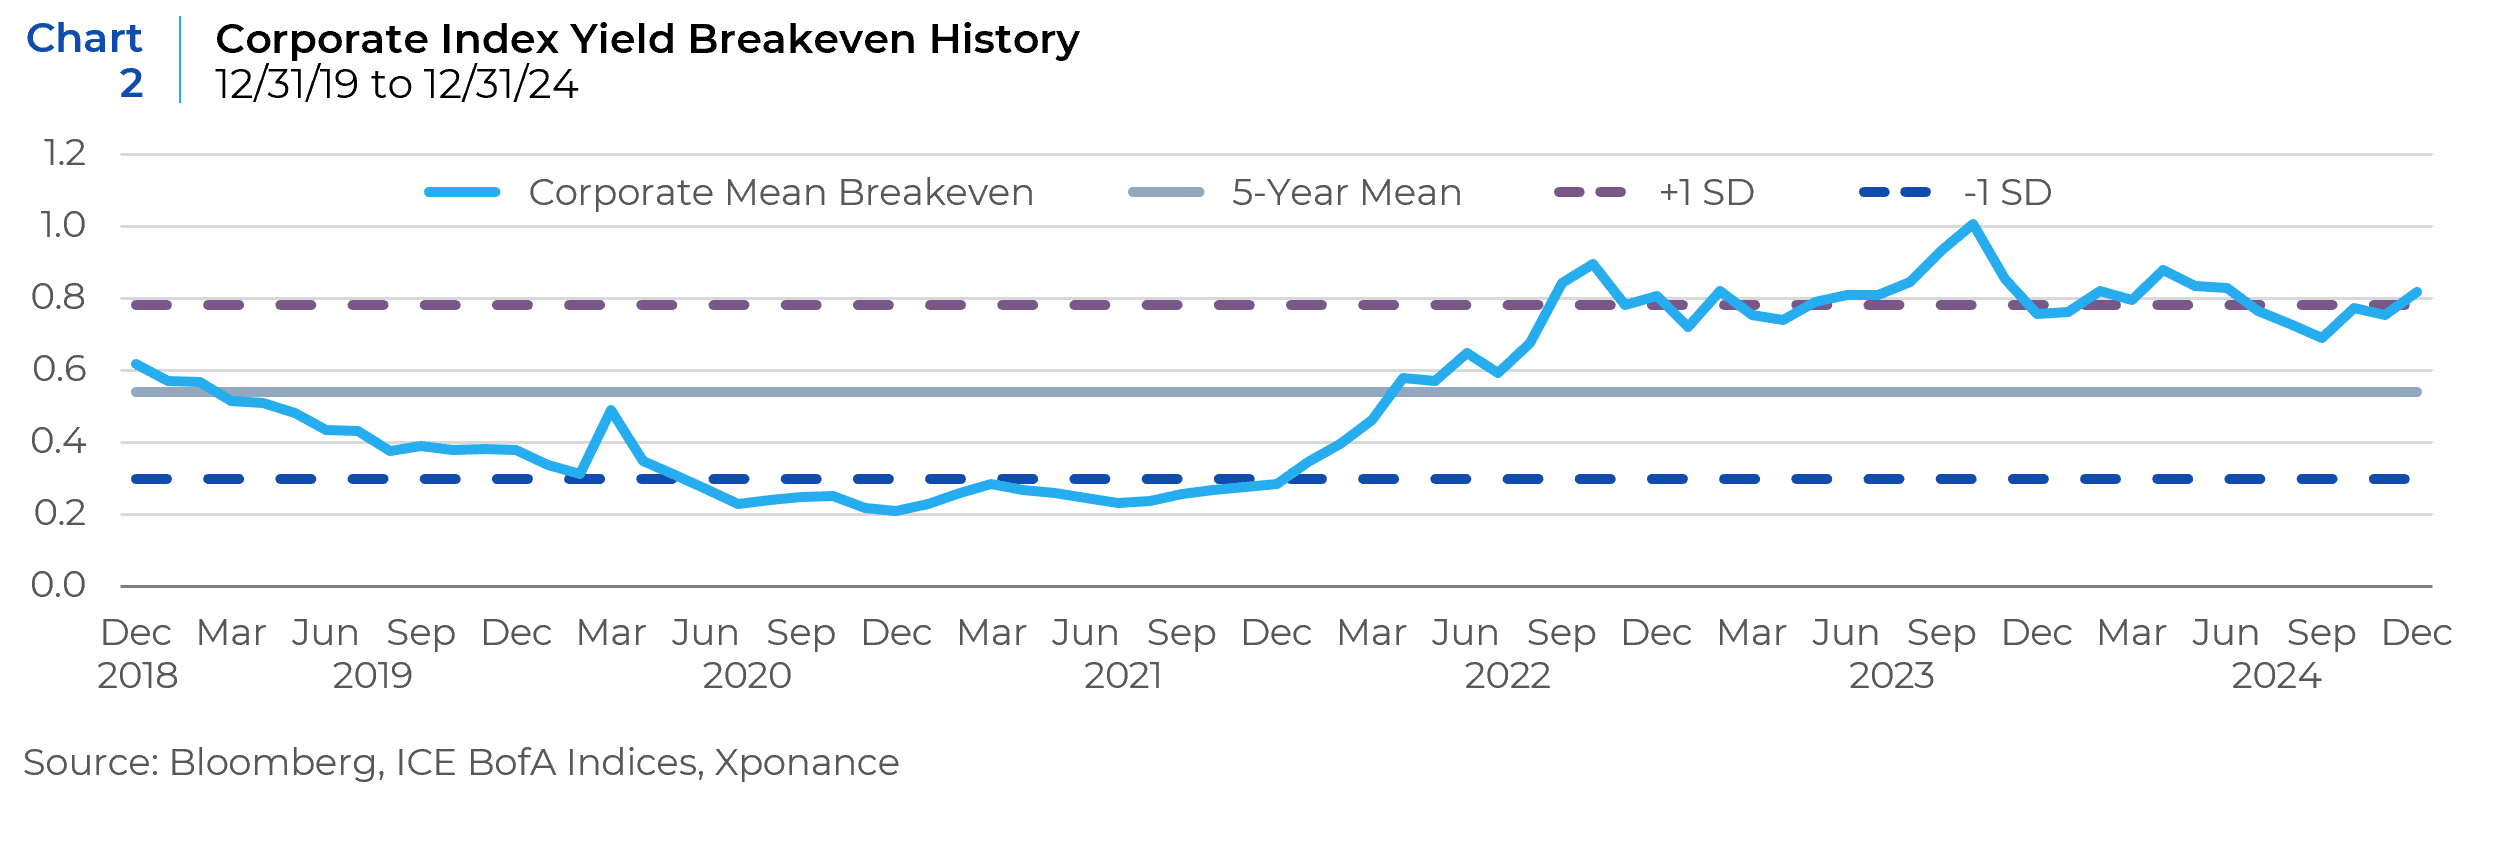
How does one weather fixed income markets against this backdrop? Despite some weakening in pockets of the economy and uncertainty around both forthcoming US economic policies and geopolitics more broadly, overall yields remain attractive in US fixed income. Corporate yield breakevens (the amount of spread widening that a bond can take before its total return turns negative) remain attractive by historical standards. Given our view that a bear steepener is likely to continue, both for the Treasury curve and credit curves (see our 3Q24 update for context) we continue to believe an overweight to the belly of the curve is appropriate. While this tactic applies to both rates markets and spread product like corporates, success with security selection in corporates will rely upon carefully protecting the downside by avoiding low-spread yet higher volatility issuers and sectors. Corporate spreads are stuck at very low absolute levels, both among issuers in each sector and also between subsector classifications. With both correlations this high and absolute levels this low, downside protection is for sale in corporates. Among other sectors in broad market indices, agency MBS is one area with reasonable valuations from a historical perspective. Given the solid risk adjusted return profile for the sector, we believe increased allocation to MBS makes tactical sense, especially given the convexity characteristics of the coupon distribution in the marketplace. The first quarter of the year, corresponding to the famous “First 100 days” of a new presidency, will tell us a lot more about any changes we need to make as we and the markets separate hype from reality when it comes to the priorities of the incoming administration.
This report is neither an offer to sell nor a solicitation to invest in any product offered by Xponance® and should not be considered as investment advice. This report was prepared for clients and prospective clients of Xponance® and is intended to be used solely by such clients and prospective clients for educational and illustrative purposes. The information contained herein is proprietary to Xponance® and may not be duplicated or used for any purpose other than the educational purpose for which it has been provided. Any unauthorized use, duplication or disclosure of this report is strictly prohibited.
This report is based on information believed to be correct but is subject to revision. Although the information provided herein has been obtained from sources which Xponance® believes to be reliable, Xponance® does not guarantee its accuracy, and such information may be incomplete or condensed. Additional information is available from Xponance® upon request. All performance and other projections are historical and do not guarantee future performance. No assurance can be given that any particular investment objective or strategy will be achieved at a given time and actual investment results may vary over any given time.

