FORESIGHT | FIS VIEWS
Crowded trade risks, while often unappreciated by investors, can be real and significant. They can be viewed as a byproduct of the immense proliferation of index and index-like products. While these products meet important investor needs, their predominance has led to market conditions that can greatly intensify selloffs-and could expose equity managers to greater than expected losses in the event of a market downturn.
What can managers do to beef up their risk management chops? We discuss three analytic techniques investors can use (deployed here at FIS) to identify and manage the risks associated with crowded trades. This is an important risk management step for both allocators and portfolio managers as the stock market will always create surprises, especially in volatile markets.
While the market started the year strong, the preeminent market feature over the past few months has been the rise in volatility. Regardless of the cause, the VIX, the most common measure of market volatility, has risen from its record lows of below 11 to as high as 17 in recent months. The rise in volatility has included several large single day drops which caught some investors off guard and forced them to make adjustments to their risk management practices.
One area in need of focus from risk managers that is particularly susceptible to high volatility environments is the risk associated with “crowded trades.” Crowded trades occur when many market participants trade the same security or securities while employing the same or similar strategy. In other words, many people trade the same stock for the same reason. While this can drive the price of a stock up during the accumulation phase, this can also create liquidity shortages that create forced selling at fire sale prices when that same stock moves out of favor.
One of the best known examples of this type of market dislocation occurred in August 2007 when many quantitative strategies suffered losses. It turned out that the strategies were all using similar factors to identify stocks, so that when those factors fell out of favor, there was a mass rush to the exit door. This drained the liquidity of affected positions and caused larger losses than most investors expected.
Today’s stock market is even more complex than in 2007 as there has been substantial growth of investment products which make buy and sell decisions by grouping stocks with similar attributes or factors together. This creates an environment in which a few large players can dominate a stock’s liquidity and exacerbate crowding risk.
Some examples of these types of products include:
Quantitative Hedge Funds that employ an algorithmic approach to buy and sell securities. They often utilize leverage and have large short positions which make them vulnerable to potential forced selling when the market moves against them.
Smart Beta Products that try to capture the alpha of active investing by employing a rule based approach to buy and sell decisions. These strategies generally choose securities based on exposure to specific quantitative factors. There has been substantial growth in the number of Smart Beta products offered to investors and the total assets invested in Smart Beta strategies because of the increased awareness of factor based analysis coupled with ETF adoption.
Exchange Traded Funds (ETFs) that are similar to index funds, but unlike index funds trade in real-time like stocks. At over $5 trillion and counting, ETFs are possibly the fastest growing segment of the market, driven by demand for a passive, low fee approach of investing. ETFs track both large commonly known indices and some smaller and more obscure indices. Some also deploy leverage. By definition the stocks in an ETF are bought for the same reason, being included in an index. The growth of the segment creates a higher likelihood that a selloff can put pressure on an individual security or group of securities.
While any single one of these product types can dominate the trading activity of a particular stock, the combined power of these products together can suck up virtually all of the liquidity of a specific stock causing major price drops in selling environments. The increased trading activity associated with a volatile market makes this type of selloff all the more likely and raises the risk associated with crowded trades.
This leaves many investment managers exposed to the risk of greater than expected losses in the event of a market downturn. However, there are now several mathematical techniques that allow allocators to assess this risk when evaluating asset managers. Interestingly, these techniques analyze the potential risks on a portfolio level, based on factor exposures, rather than on an individual security level. This facilitates understanding the crowding risk associated with a particular manager or strategy.
For example, pairwise correlation is a technique that examines the correlation between stocks in a portfolio that have high exposure to a given factor. The primary intent is to track how well stocks within the top and bottom quintiles move together. The higher the correlation the more likely the factor could be exposed to crowding risk.
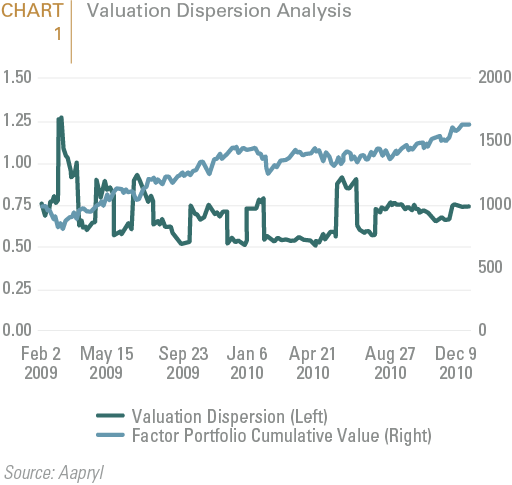
Another technique is valuation dispersion. This technique examines the average dispersion of price to book ratios for the portions of a portfolio with the most and least exposure to a given factor. As can be seen on the green line in Chart 1, the valuation dispersion for a given factor may vary across time. Valuation dispersion measures crowdedness of a factor/group of stocks, and it increases when the spread widens between the top and bottom quintile stocks because the top quintile has become inflated/expensive. When the dispersion is larger, it is more likely that the portfolio could be exposed to crowding risk. When the dispersion is lower, the risk of significant crowding risk is less likely. This method can be particularly effective when looking at growth and momentum factors which are not based on valuation.
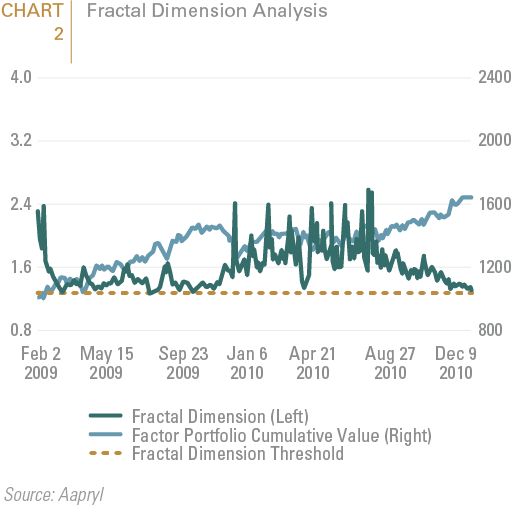
One final technique worth discussing is fractal dimension analysis. It is based on research that shows that market participants have different time-horizons so that they may view the same position differently. An investor with a long-term horizon may not need to sell a position based on a short term move, while an investor with a shorter time horizon may need to do so. Too much short-term activity can create liquidity risk. This risk can be identified by analyzing the ratio of long-term and short term activity of the portion of a portfolio most exposed to a particular factor. Chart 2 shows an example of the analysis. The green line in the chart displays the long to short term equilibrium of the factor’s trading activity against a threshold (gold line). When the green line touches or is below the gold line it indicates that there is a high level of short term activity which may be an indication of crowding risk.
While the risks posed by crowded trades are often underappreciated, the risks are real and can be significant. These are a few examples of techniques that allow investors to assess the overall crowding risk in a portfolio. This is an important risk management step for both allocators and portfolio managers as the stock market will always create surprises, especially in volatile markets. Successful investors are surprised by the market less often because they consider more potential risks in their decision making. In that light, identifying crowded trade risk can be the difference between success and failure.
This report is neither an offer to sell nor a solicitation to invest in any product offered by FIS Group, Inc. and should not be considered as investment advice. This report was prepared for clients and prospective clients of FIS Group and is intended to be used solely by such clients and prospects for educational and illustrative purposes. The information contained herein is proprietary to FIS Group and may not be duplicated or used for any purpose other than the educational purpose for which it has been provided. Any unauthorized use, duplication or disclosure of this report is strictly prohibited.
This report is based on information believed to be correct, but is subject to revision. Although the information provided herein has been obtained from sources which FIS Group believes to be reliable, FIS Group does not guarantee its accuracy, and such information may be incomplete or condensed. Additional information is available from FIS Group upon request.
All performance and other projections are historical and do not guarantee future performance. No assurance can be given that any particular investment objective or strategy will be achieved at a given time and actual investment results may vary over any given time.