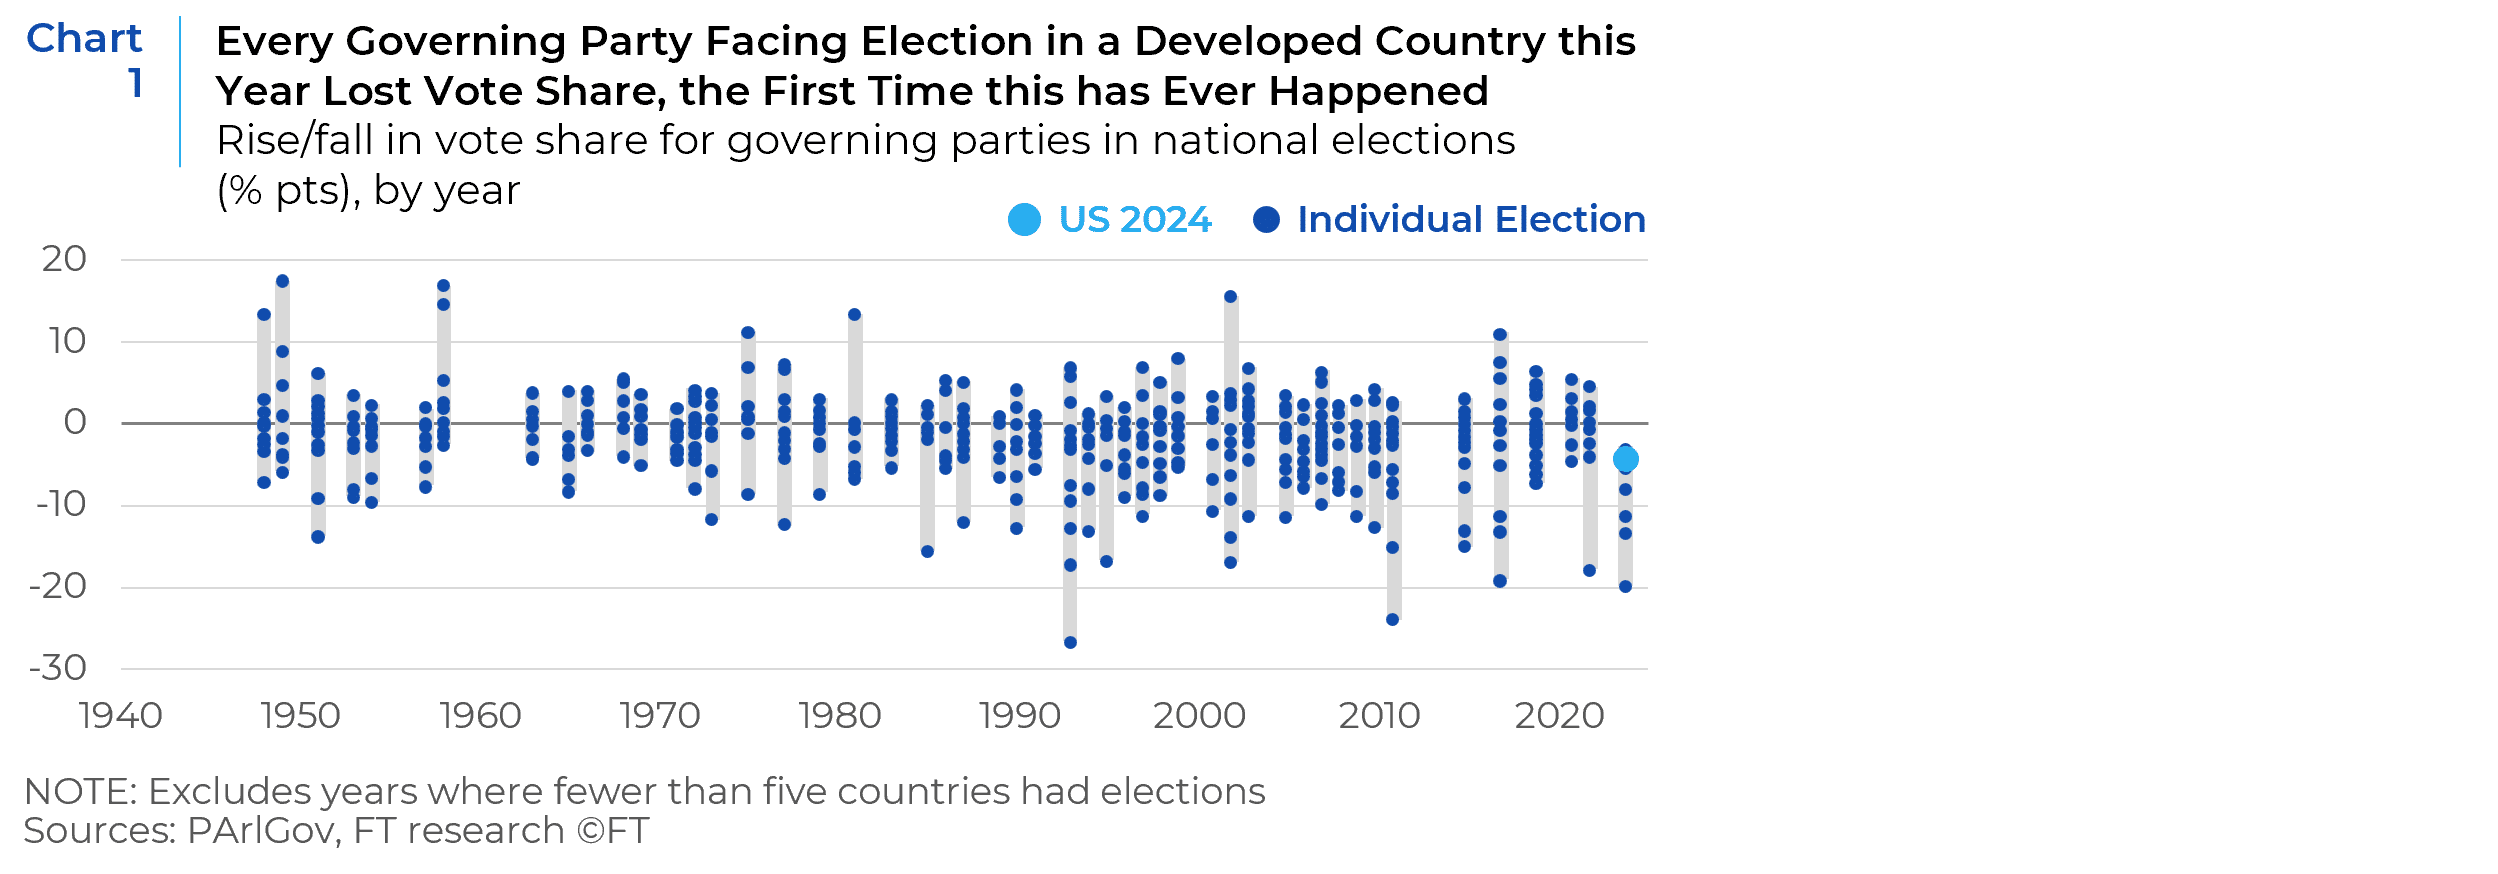
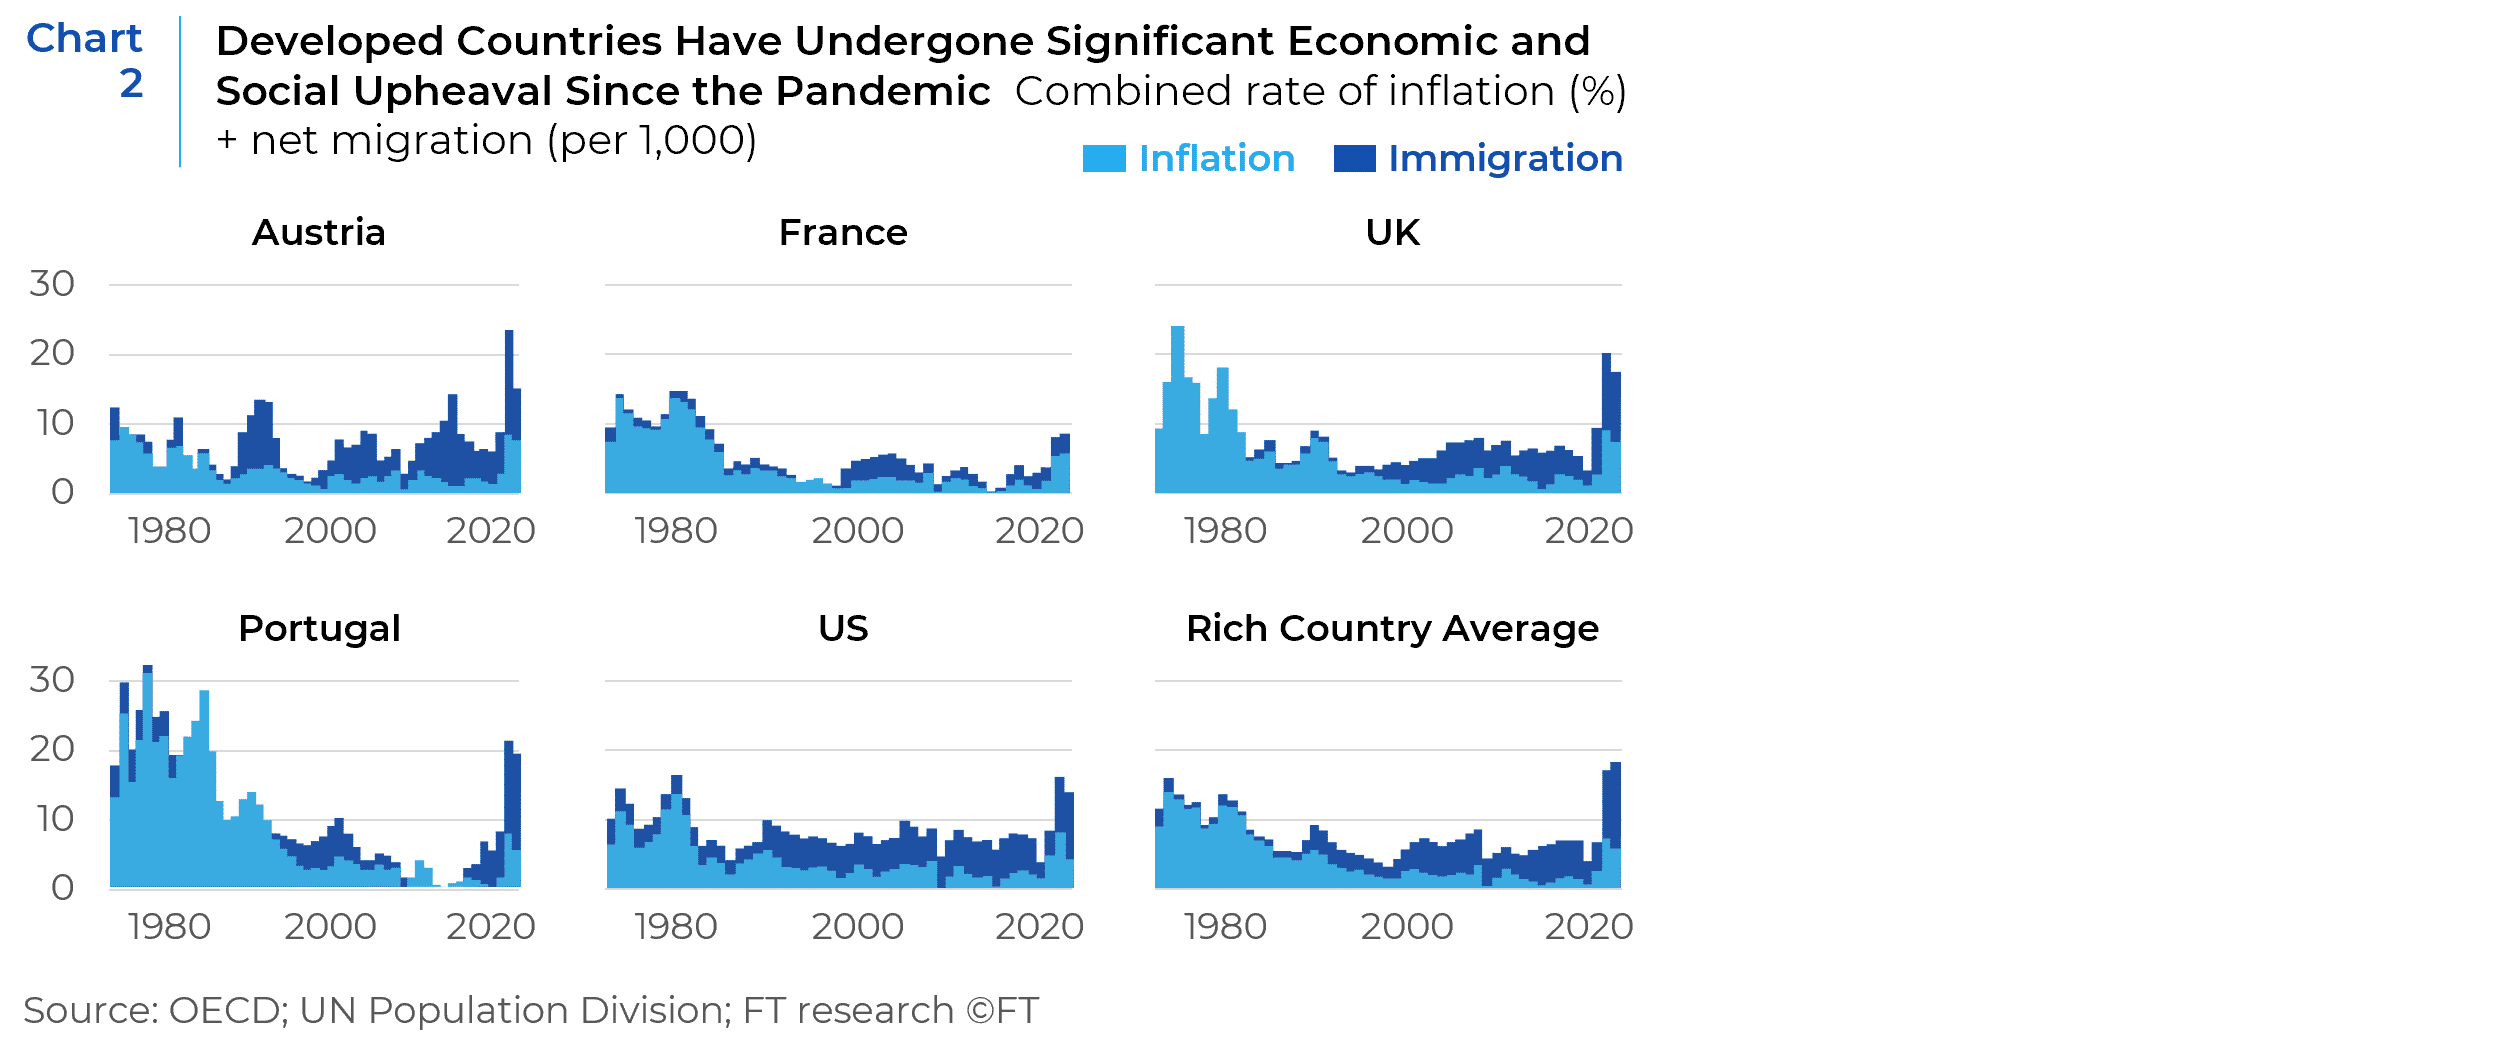
The electorate is in a foul mood. Not just in the U.S., but globally, where incumbent parties have faced unprecedented levels of reversal. In each of the 10 major countries tracked by the Financial Times’ ParlGov global research, incumbent leaders were either given the boot or a painful thrashing. Some like Emmanuel Macron’s Ensemble coalition and Narendra Modi’s BJP survived but only barely. Others, like Japan’s long dominant Liberal Democrats, the British Tory Party, and now the U. S. Democratic Party, did not (see Chart 1). The two issues that dominated the elections in Europe and the U.S. were immigration and inflation (see Chart 2). In this paper, (Part I),I look at the drivers behind inflation. In Part II, I will evaluate salient macroeconomic, demographic, and social factors that should inform immigration policy. In Part III, I will analyze policy solutions that have been put forward to address both issues, as well as their investment implications.
Key conclusions include:
- 2024’s anti-incumbent movement, including Donald Trump’s victory in the U.S. presidential election, largely reflects a generalized anger at a “system” from which working class voters feel increasingly disconnected and ignored. Their challenges have been masked by aggregate economic measures, such as GDP and CPI, that do not reflect their everyday reality. Over the last 5 decades they have struggled to stay upright on a treadmill that has been accelerating backward. Even before the pandemic, real wages for the median U.S. household over the previous 40 years were flat and declined for men in the lowest income decile. Thus, only 36.5 percent of adults surveyed in 2023 by CNBC’s International Your Money Financial Security Survey said they felt they’re better off financially than their parents, and 42.8 percent said they were worse off.
- The 2024 election results were yet another resounding expression of the class divisions that I discussed in two prior papers entitled The Revenge of the Precariat over Davos Man and I’m Mad as Hell and I’m Not Going To Take This Anymore- The Revenge Of The Precariat Part Two. The first paper came after the Brexit vote in 2016. The second succeeded the election of Donald Trump later that year. The Precariat stands for the modern proletariat, a globally “precarious class” of people who believe that prosperity is out of reach and that they will be worse off than their parents and grandparents. Davos Man, a term coined by the sociologist Samuel Huntington, symbolizes the global elite. (The inset below contextualizes the current political moment within this framework). Brexit, Trump 2016, Trump 2024 and other populist elections thus offered a singular opportunity for the Precariat to collectively raise their middle finger at generations of Davos men and policies.
- Pandemic-related increases in production and shipping costs sparked the initial post pandemic surge in inflation, which was further exacerbated by pent up demand for household goods and buoyed by fiscal stimulus payments. Inflation was thus a global phenomenon, particularly among advanced economies where it rose to 8.7 percent in 2022 and recently dropped to 2.6 percent. In the U.S., inflation peaked at a slightly higher 9.1 percent by mid-2022 and has also meaningfully declined to a more moderate 2.6 percent level.
- But inflation is a regressive tax which disproportionately burdens lower income households. Based on analyses of the consumption patterns of diverse groups, post-pandemic surges in transportation, housing, and food inflation disproportionately affected younger, lower income, Latino and black households. Accordingly, in 2024, President Trump definitively increased the Republican Party’s support among low-income voters and younger voters; and he regained lost ground among middle-income voters. Though there are many non-inflationary factors (such as race and gender bias, as well as religious/social values) that influenced the election’s results, inflation’s disparate effect on these groups, or at least its perceived impact, clearly contributed to the election’s results.
—
Inset – The Precariat vs. Davos Man
Davos Man congregates at the exclusive the World Economic Forum every winter in the Swiss Alps. Like the late Winston Churchill, who once said that “the best argument against democracy is to spend five minutes with the average voter,” Davos Men believe that their superior education and connections have earned them the right to lord over the Precariat. Though most were born on third base, modern Davos Men are not burdened by the same “noblesse obliges” of their forbears. Men such as Roosevelt and Eisenhower, who expanded America’s promise beyond their own class. Among corporate chieftains, Andrew Carnegie and J.D. Rockefeller could be ruthless and bore the race and gender biases of their time, but they nevertheless devoted vast sums to educating and uplifting the masses.
Based solely on their accumulation of material “stuff” or access to basic services, the Precariat are not poor in a global (or even historical) sense. Yet, as has been true of most class-based revolts, relative privation and perceived marginalization within one’s community trumps absolute condition. Unlike the prior Industrial Revolution, and the rise of mass production of the 1950s and 1960s, their lot has not materially improved in the Information Age. Even before the 2008 global financial crisis (GFC), prosperity had by passed the Precariats. Today’s corporate giants, such as Facebook, Amazon and Apple are far less labor intensive than their counterparts in 1950’s and 60’s, such as GM and Xerox, which propelled millions of the Precariat into the middle class. Many of their jobs have been replaced by the combination of technology and globalization, that led to a hollowing out of communities that were havens of opportunity for Precariat labor, as well as a decrease in the share of national income going to labor and a rising share of income going to capital, which of course is primarily owned by Davos men. As if to confirm that the system was “rigged” against them, in 2008, they saw financial chieftains whose shenanigans led many to lose their homes and savings evade accountability, walk away intact and, in some cases, enriched. The Precariat’s “leaders” have not emerged from their own ranks. After all, former Brexit leaders, such as Michael Gove and former British Prime Minister Boris Johnson are both Oxford Men. While Mr. Trump bills himself as a political outsider, he is hardly Precariat. Each of them have profited from a similar play book: sow distrust of political and financial establishments; objectify minorities and immigrants as the source of the Precariats’ deprivations, while making vague promises to bring back jobs that have been savaged by trade (their favorite chimera) and technological advancement (which, though more pernicious for blue collar workers, is rarely discussed). Once elected, their economic platform on taxes, labor, trade, and anti-trust policies have disproportionately helped their fellow Davos elite. But they continue to galvanize a Precariat coalition bound by disaffection with rapid changes in our societal makeup and economic opportunity; as well as a generalized anger at a “system” from which they feel increasingly disconnected.
The author David Brooks insightfully described the political implications of the clash between the Precariat and Davos Man as follows:
“In 1960, John F. Kennedy lost the white college-educated vote by two to one and rode to the White House on the backs of the working class. In 2020, Joe Biden lost the white working-class vote by two to one and rode to the White House on the backs of the college-educated. When a society is more divided by education, politics becomes a war over values and culture. In country after country, people differ by education level on immigration, gender issues, the role of religion in the public square, national sovereignty, diversity, and whether you can trust experts to recommend a vaccine. … Wherever the Information Age economy showers money and power onto educated urban elites, populist leaders have arisen to rally the less educated: not just Donald Trump in America but Marine Le Pen in France, Viktor Orbán in Hungary, Recep Tayyip Erdoğan in Turkey, Nicolás Maduro in Venezuela. These leaders understand that working-class people resent the know-it-all professional class, with their fancy degrees, more than they do billionaire real-estate magnates or rich entrepreneurs. Populist leaders worldwide traffic in (inflammatory rhetoric) aimed at telling the educated class, in effect: Screw you and the epistemic regime you rode in on.”
David Brooks, How the Ivy League Broke America, Atlantic Magazine, November 14, 2024.
—
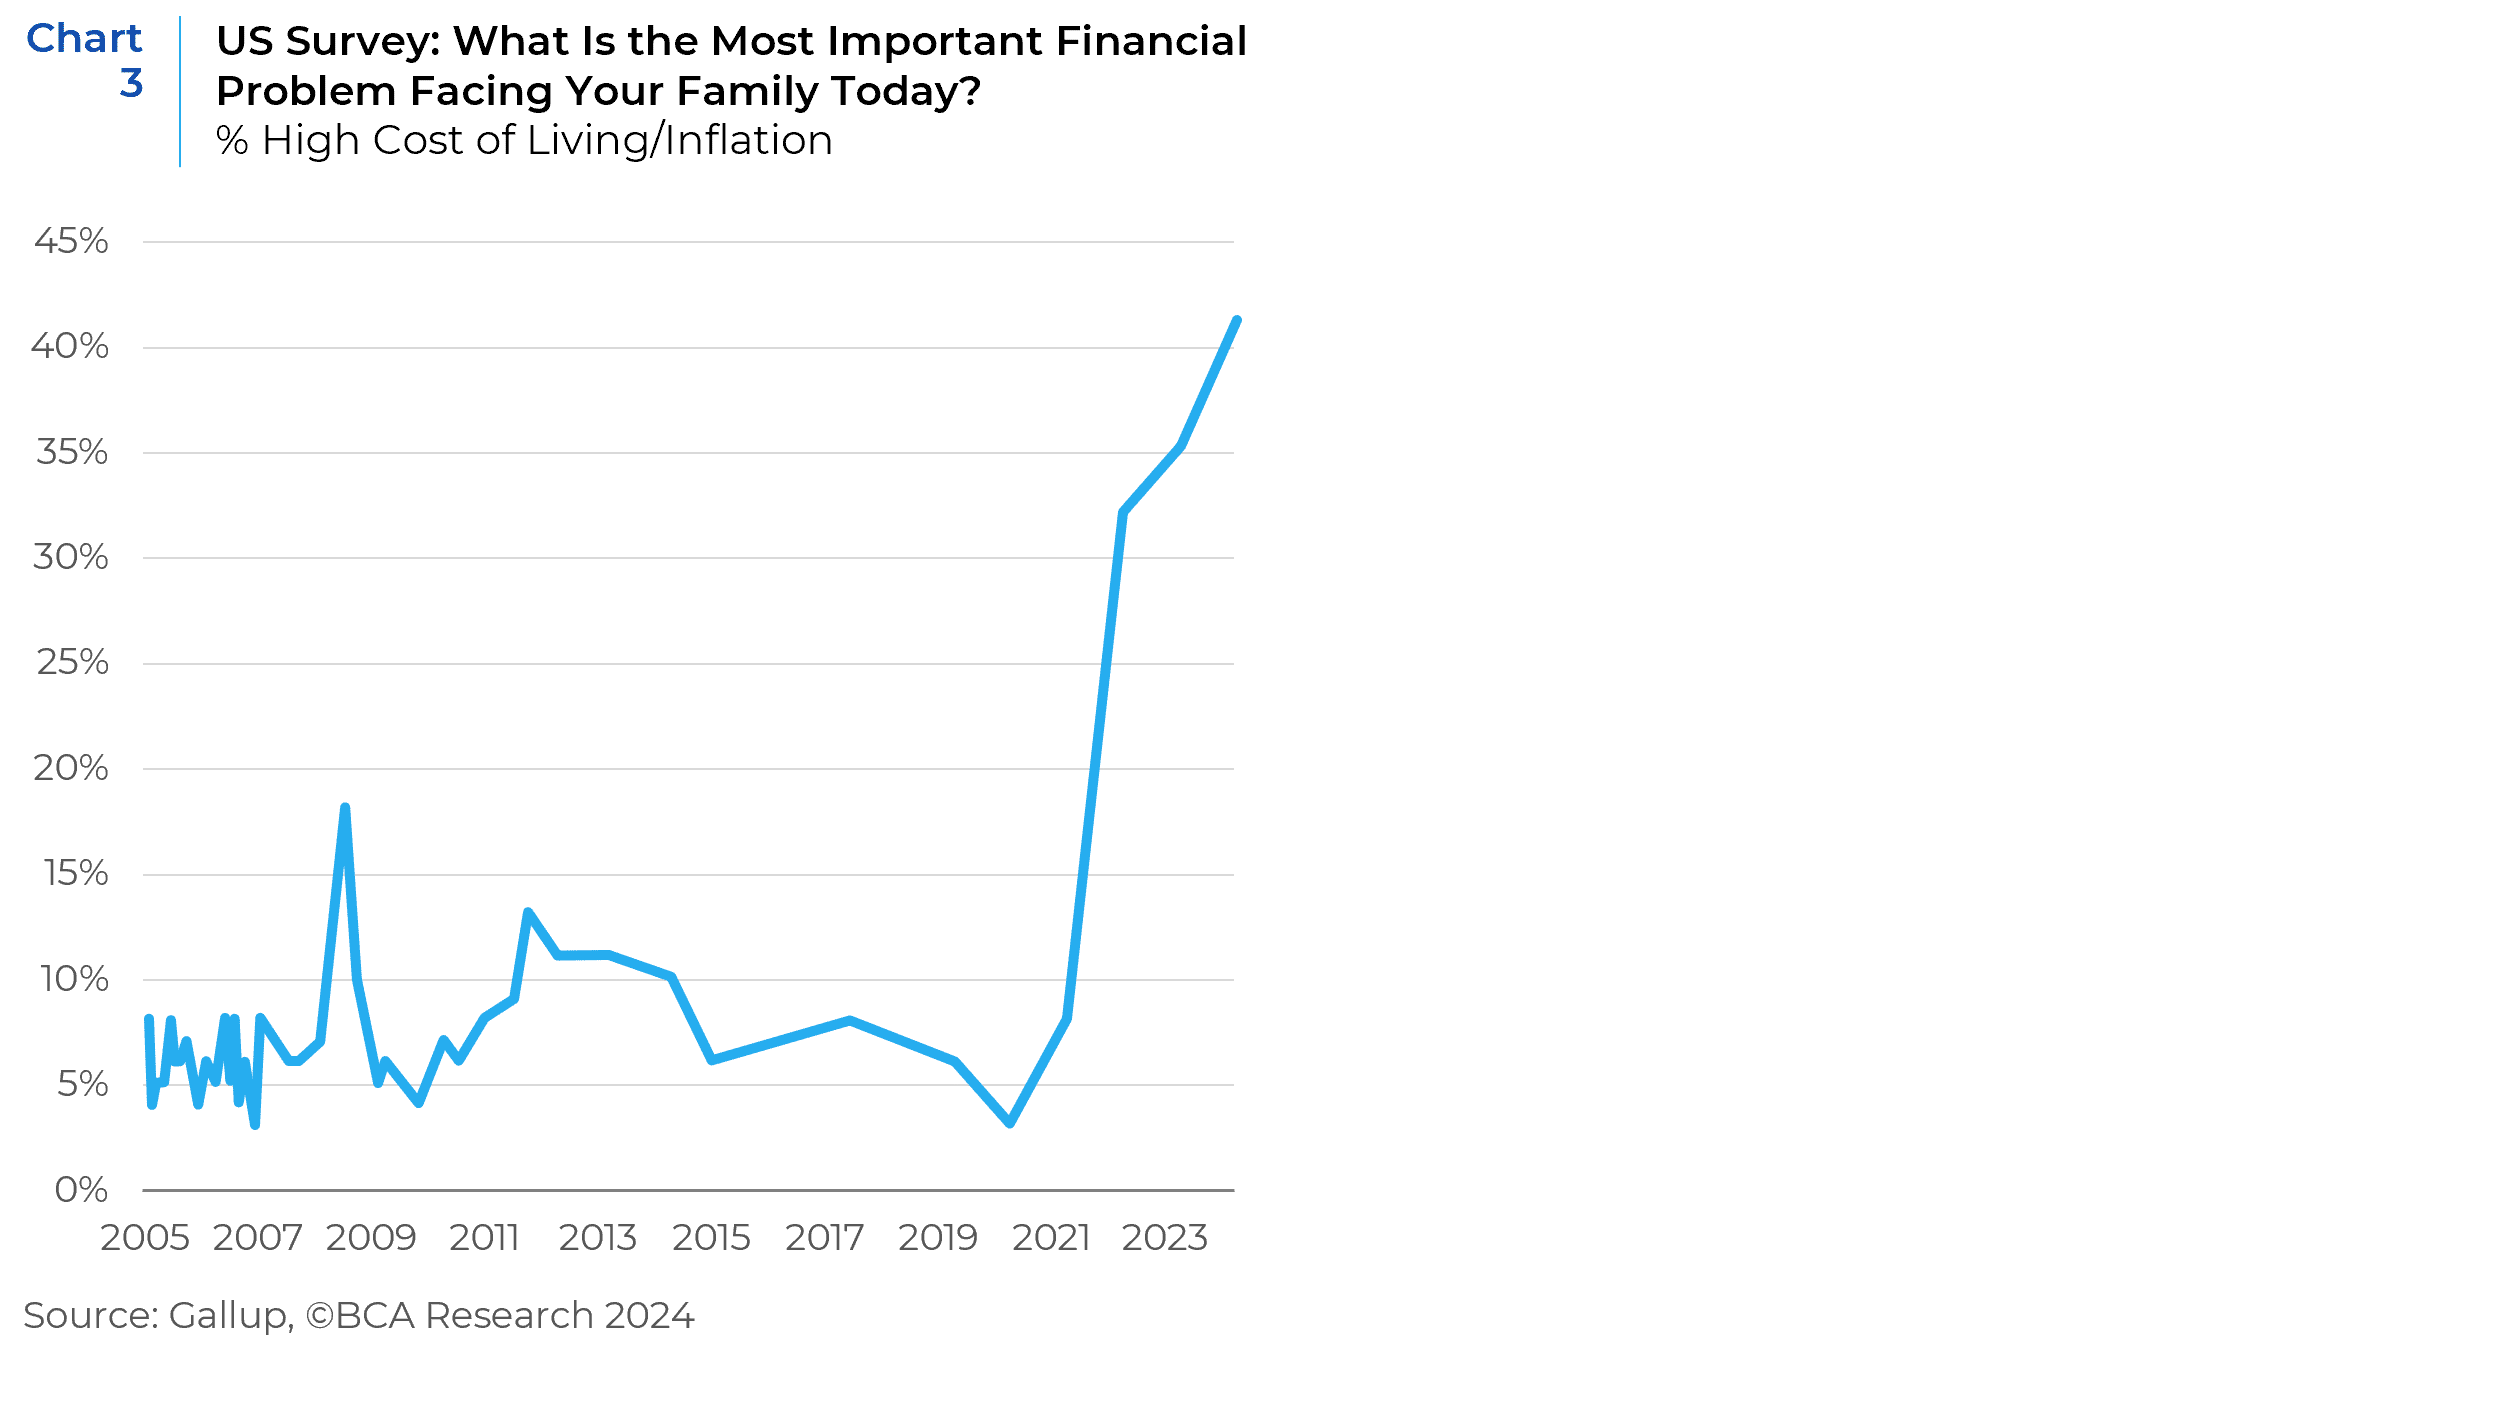
After a thirty-year run of low and stable inflation during which the core U.S. measure (which excludes volatile food and energy prices) fluctuated in a narrow range around 2 percent, post -pandemic inflation spiked to a peak of 9.1 percent in the United States and 8.7 percent among advanced economies in 2022. Inflation, therefore, rapidly shifted from a forgotten curiosity to the most salient economic factor driving public concern (see Chart 3). But like immigration, the reductive political rhetoric around inflation has been grossly misleading. Moreover, policy makers and the media’s focus on aggregate measures of consumer inflation (i.e., the Consumer Price Index (CPI), and the Federal Reserve’s preferred measure, the arguably more dynamic Personal Consumption Expenditures (PCE) Price Index), mask the effects of inflation among disparate income groups. In the real world of shoppers and savers, these aggregate inflation measures apply to everybody…and therefore, nobody, because there is no “aggregate” American.
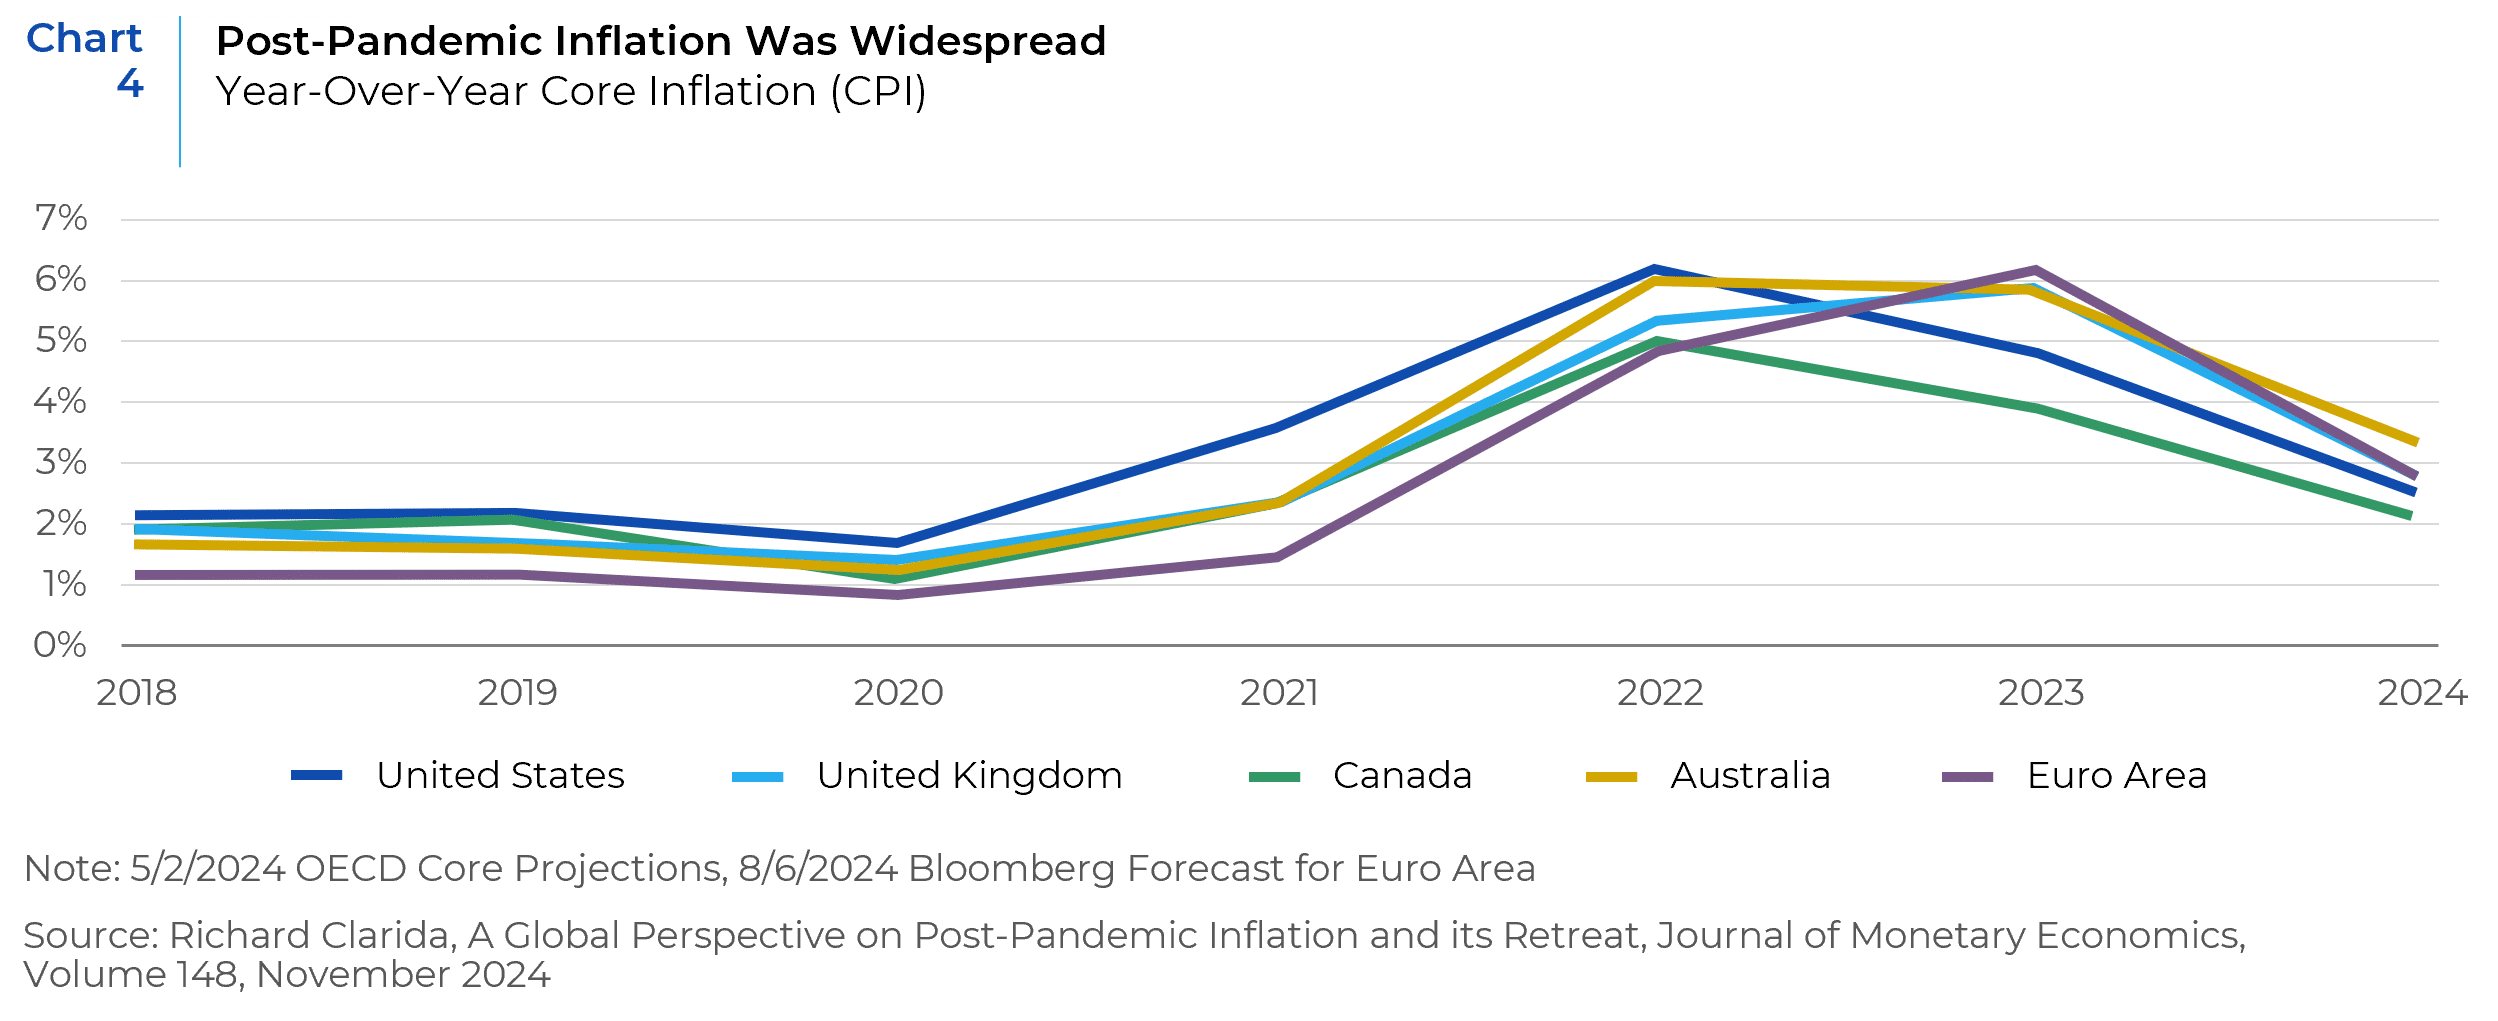
But first, I will briefly recap how we got here. In 2021, an upswing in goods pricing resulted from a combination of surging consumer demand, pandemic-related supply chain blockages and global commodity shortages. This is why, contrary to the political rhetoric, inflation raged throughout much of the world and therefore could not have been solely due to any one administration’s policies (see Chart 4). Problems in the supply chain also led to rising transportation costs, creating even more upward pressure on goods pricing. Surging commodity prices (across agriculture, metals, energy, and gas) from the global reopening, as well as supply issues in some commodity markets led to further inflation across the goods and services sector, because commodities are an input in both manufacturing and agricultural production processes. Moreover, commodity prices received another leg-up from the war in Ukraine in early 2022, which created more dislocations to commodity supply (especially in oil, gas and grains), (see Chart 5). On the demand side, lower interest rates, direct handouts through government stimulus measures and a collapse in services spending (which meant consumers substituted services spending for goods), fueled consumer purchases of physical items. In the U.S., inflation rates for household furnishings were running at 10.8% per annum by 2022, and apparel prices were up by nearly 7 percent.
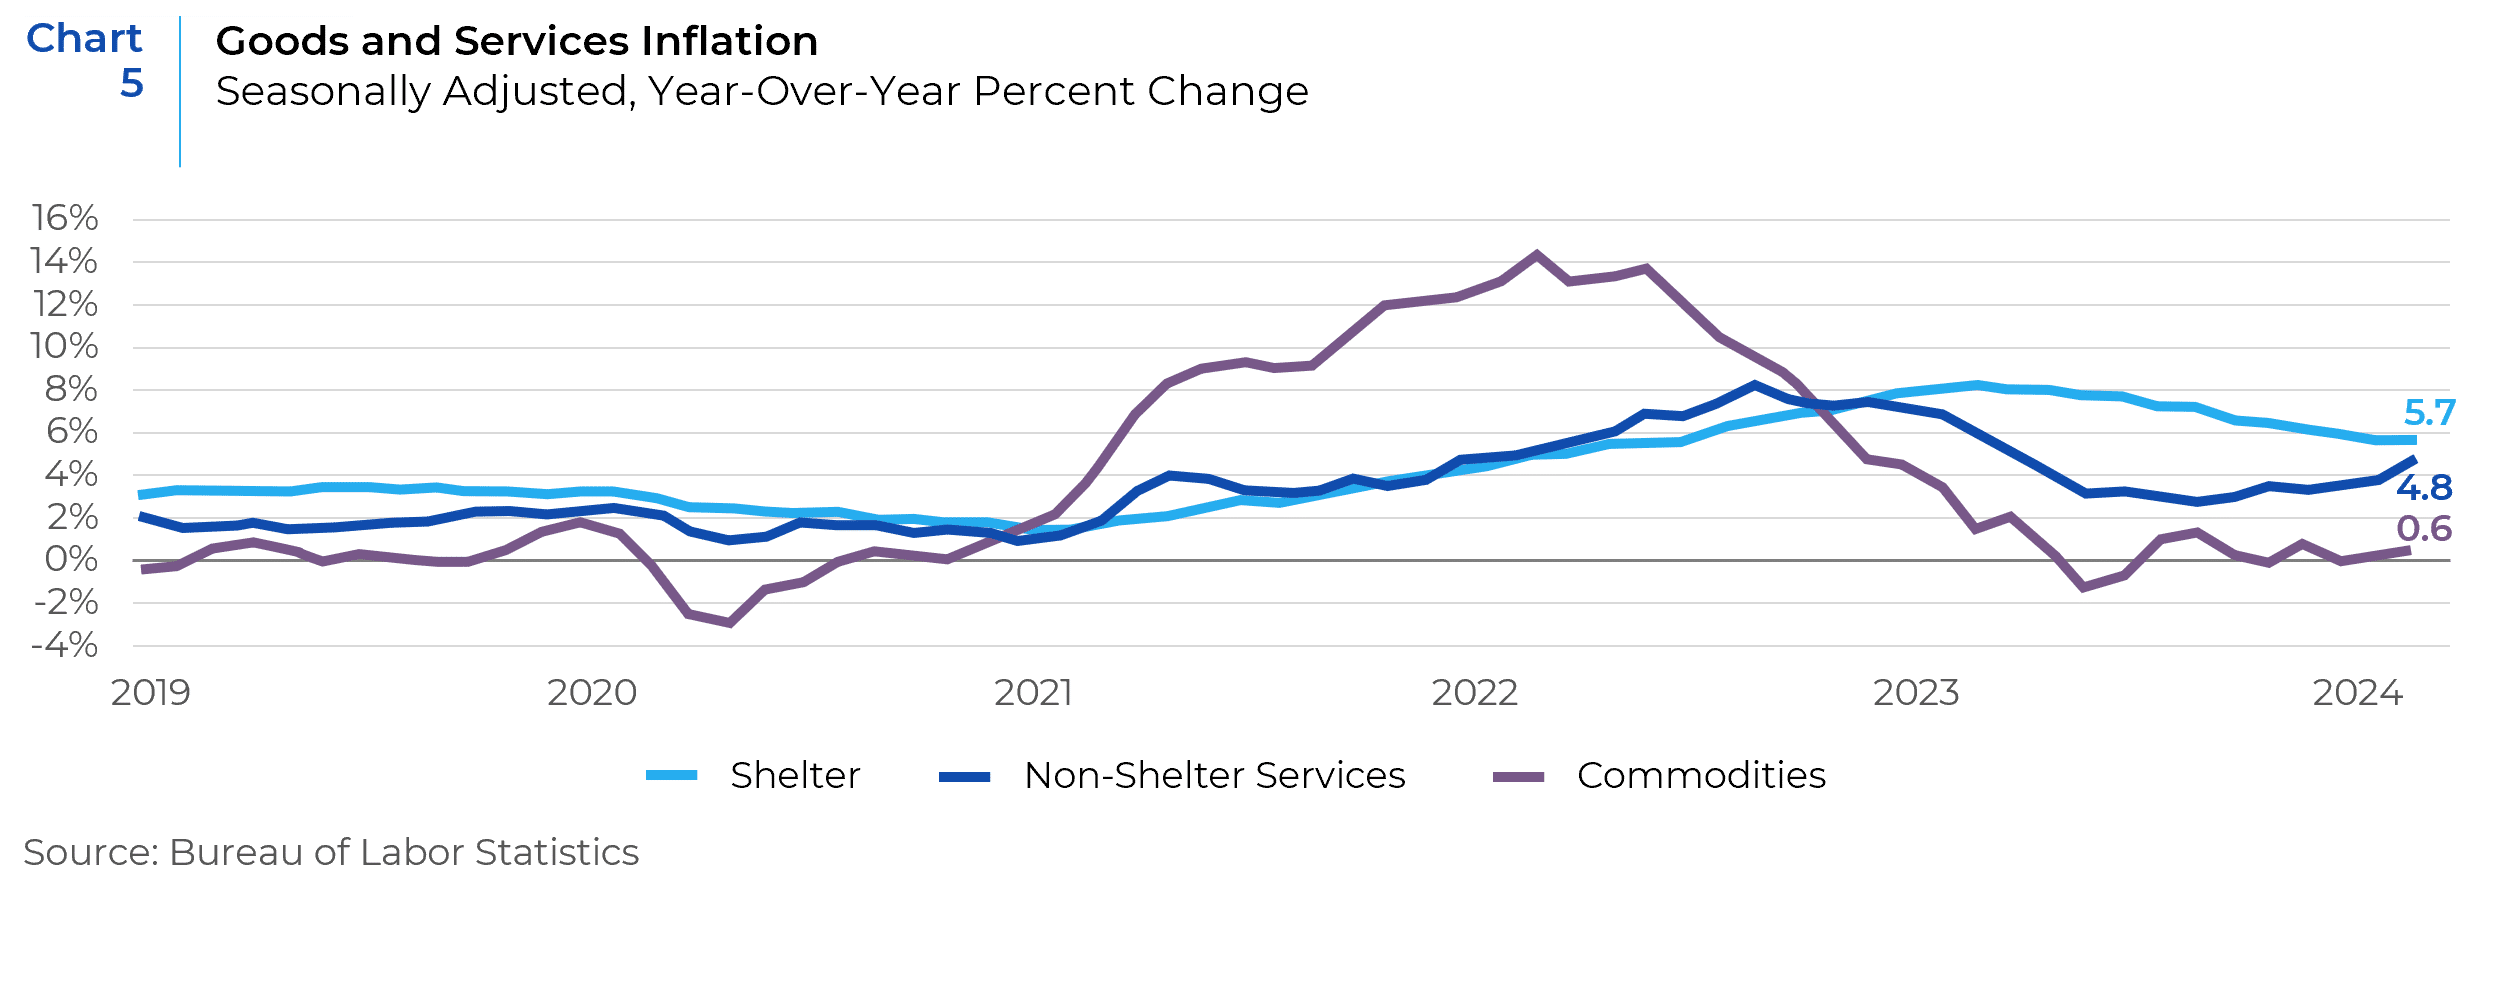
Because this surge in goods inflation was caused by extraordinary events, the market and more importantly, the Federal Reserve, assumed that it would be transitory. They were right. In November 2024, energy inflation declined by almost 5 percent and food inflation slowed to 2.9 percent. The problem was that the decline in goods prices took longer than expected. Thus, the Fed waited too long to raise interest rates and allowed it to go from a three-alarm fire in March of 2021 (at 3.2 percent), to a six-alarm fire by mid 2022 (at 9.1 percent). This delay, compounded by stimulus policies throughout the developed world, led to a second spike in the prices of services and particularly housing. In the U.S., home prices and rents have been buoyed by several structural factors, including local zoning laws that curtail the construction of higher density low-income housing as well as growing evidence of rent collusion among landlords through widespread algorithmic pricing programs. In 2022, housing demand increased as hybrid or remote work led to higher demand for more home space. In some communities, surging migration also put pressure on shelter costs. Rent inflation in November 2024 remains elevated at 5.9 percent.
In 2024, the rate of inflation markedly subsided (from 9% in early 2022 to 2.5% in the fall of 2024). This led central bankers, including Fed Chair Jay Powell to all but declare victory over inflation at the Jackson Hole summit in the summer of 2024. But by focusing on aggregate measures , such as the CPI or the PCE index, political leaders on the left as well as many financial professionals (including me) missed the reality of ongoing and acute pricing pressures faced by Americans whose income fell in the lower half of the country’s earnings strata, as well as the vast heterogeneity of inflation’s impact on different communities and, voting blocks.
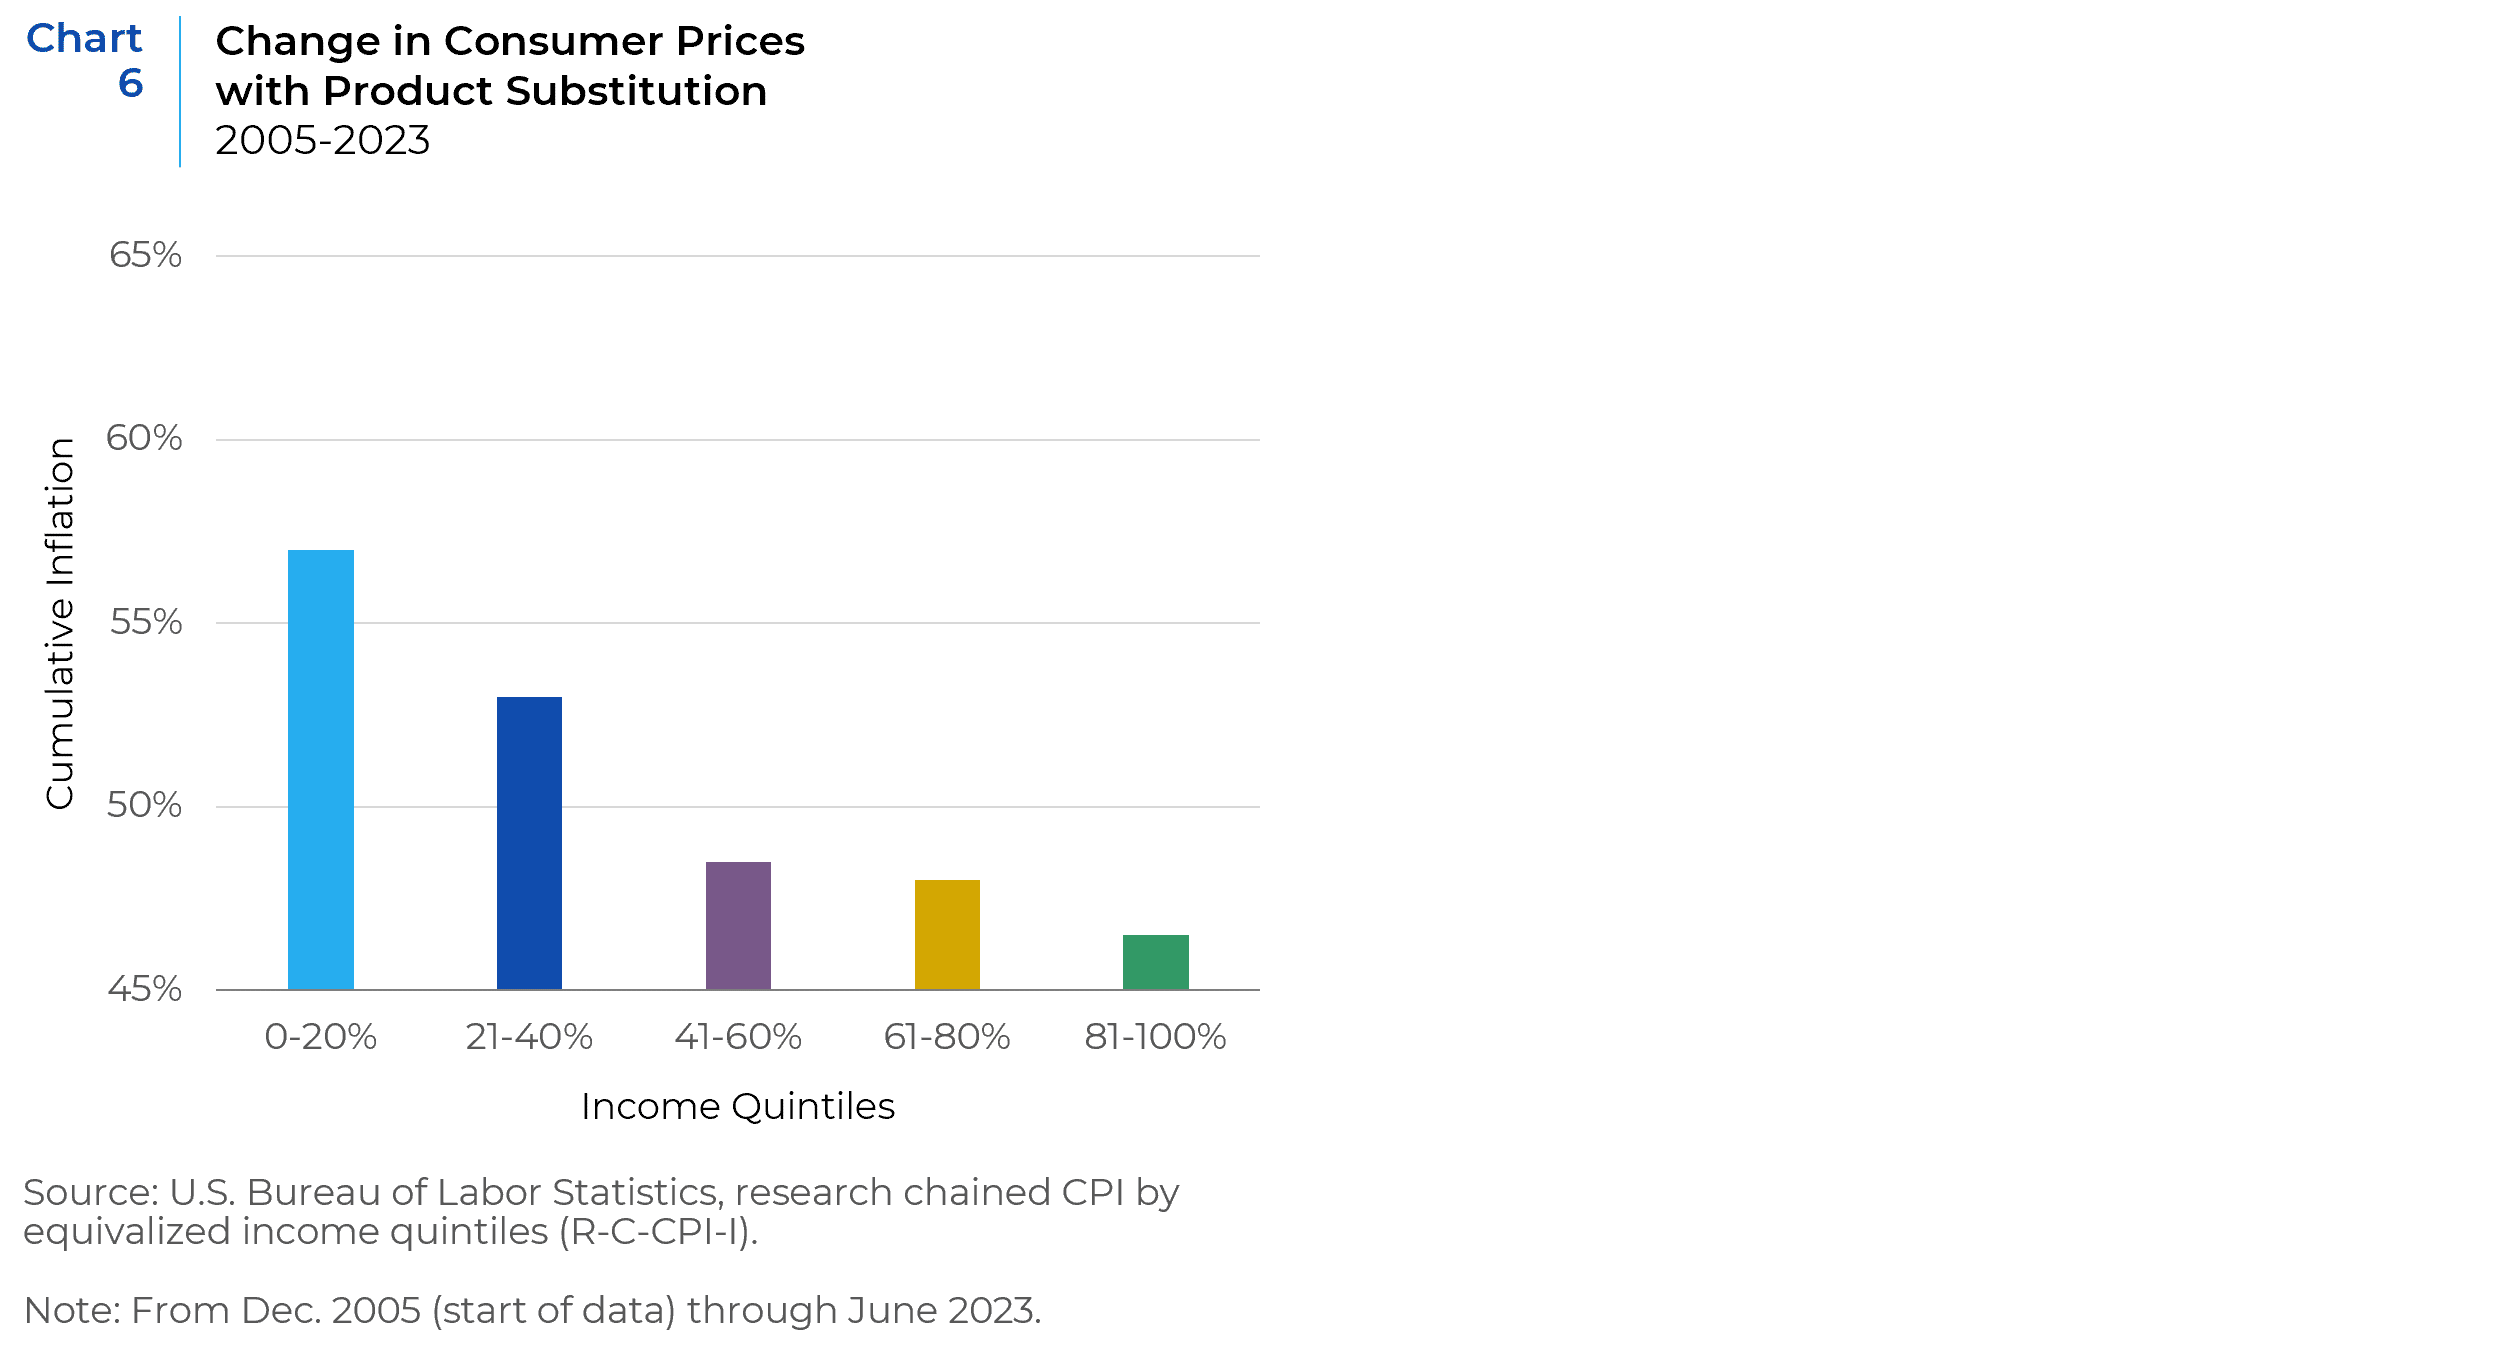
Inflation is a regressive tax; in that it imposes a greater burden on people with lower wealth and incomes. This is because lower-income families devote more spending to household necessities in proportion to discretionary purchases and savings. For example, over the 18-year period between 2005 and 2023, the U.S. Bureau of Labor Statistics (BLS) found prices for low-income households rose about 10 percent more than the average household. Lower income households also have less flexibility to adjust their spending as prices rise because they are already economizing when inflation sets in. A middle-class family may switch from Raisin Bran to a generic version or Corn Flakes when inflation sets in. But if you are a lower income family, you are more likely to already be consuming the cheaper choice. From there, the family may choose to forgo the purchase of cereal altogether. When the BLS accounted for the varying ability of households to substitute lower for higher priced goods, everyone’s inflation rate dropped, but the differences across income groups increased, with an almost 11 percentage point gap between the poorest and richest households (see Chart 6). High earning households also have more options to preserve their real wealth in the face of rising inflation, because they are more likely to own investment assets that either appreciate, pay interest or rental income. At the bottom of the income distribution, some people don’t even have bank accounts.
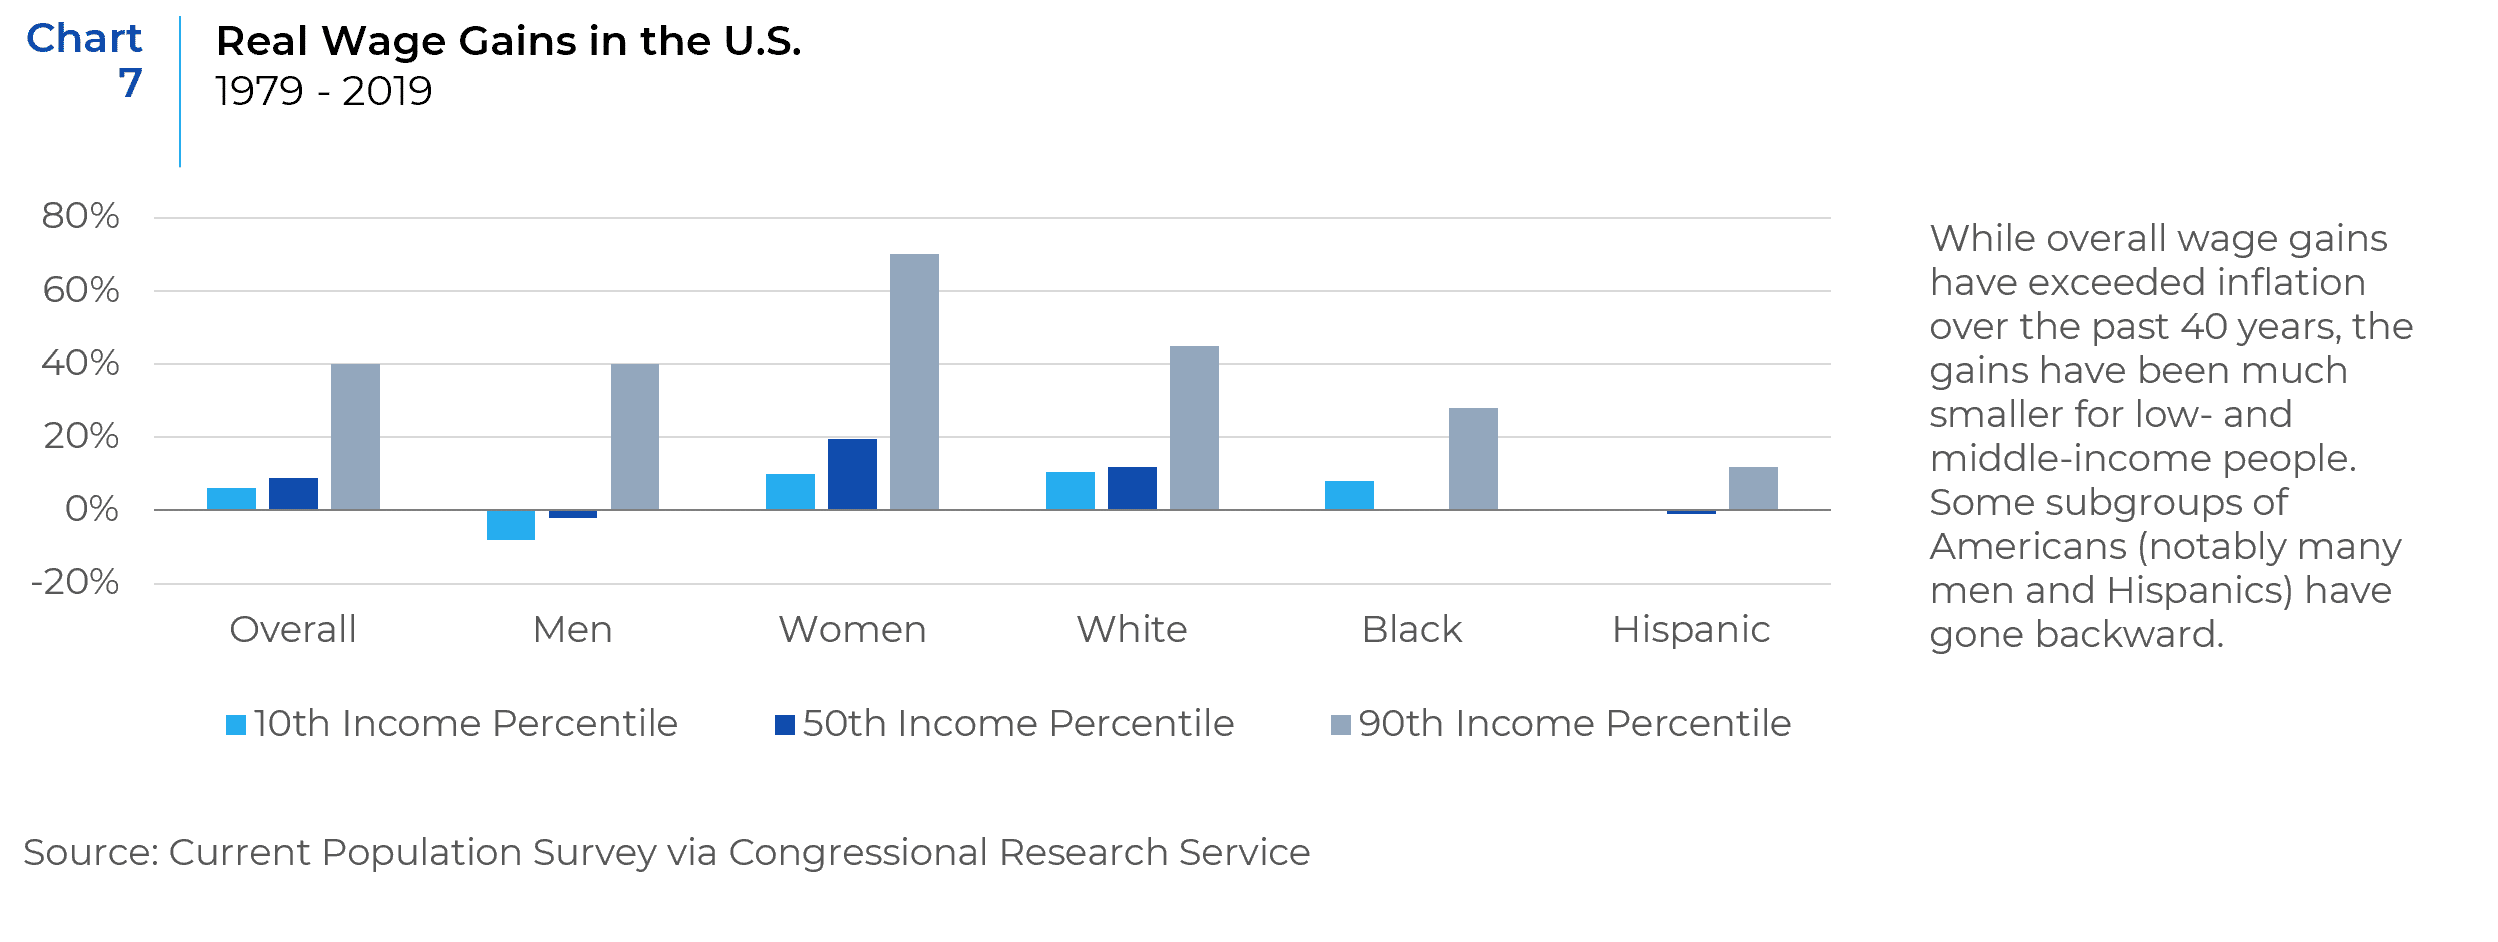
The pain of rising prices is easier to take if your paycheck keeps pace or you have the option to reduce your rate of savings rather than forgo necessities. While overall wage gains have exceeded inflation over the past 40 years, the gains have been much smaller for low- and middle-income households. For example, real wages for the median male worker have fallen 3 percent since 1979; but for male workers at the 10th percentile, they dropped almost 8 percent (see Chart 7). Those on fixed incomes have been especially vulnerable to inflation. Benefits from the primary federal welfare program, Temporary Assistance for Needy Families, are not indexed to inflation (though some individual states partly compensate with their own funds). Accordingly, Xavier Jaravel from the London School of Economics found that while the household income gap between the top and bottom quintiles grew 16 percent between 2002 and 2019, the regressive impact of inflation increased the gap to almost 23 percent. When he factored in the varying ability of households at different income levels to substitute goods, the difference grew larger, and he estimated that another 2.3 million Americans would be below the poverty line if we accounted for their higher rates of inflation.
Social Security’s indexation to a version of the CPI provides some relief. In 2022, for example, 70 million elderly and disabled Social Security recipients received a 5.9 percent bump in benefits to account for the previous year’s rise in prices. However, two factors reduce this benefit. Medicare premiums—typically deducted from Social Security checks—tend to rise faster than inflation. And unless Congress manually updates the (non-indexed) income limits in the tax code, taxes will take an increasing bite as Social Security income increases with inflation.
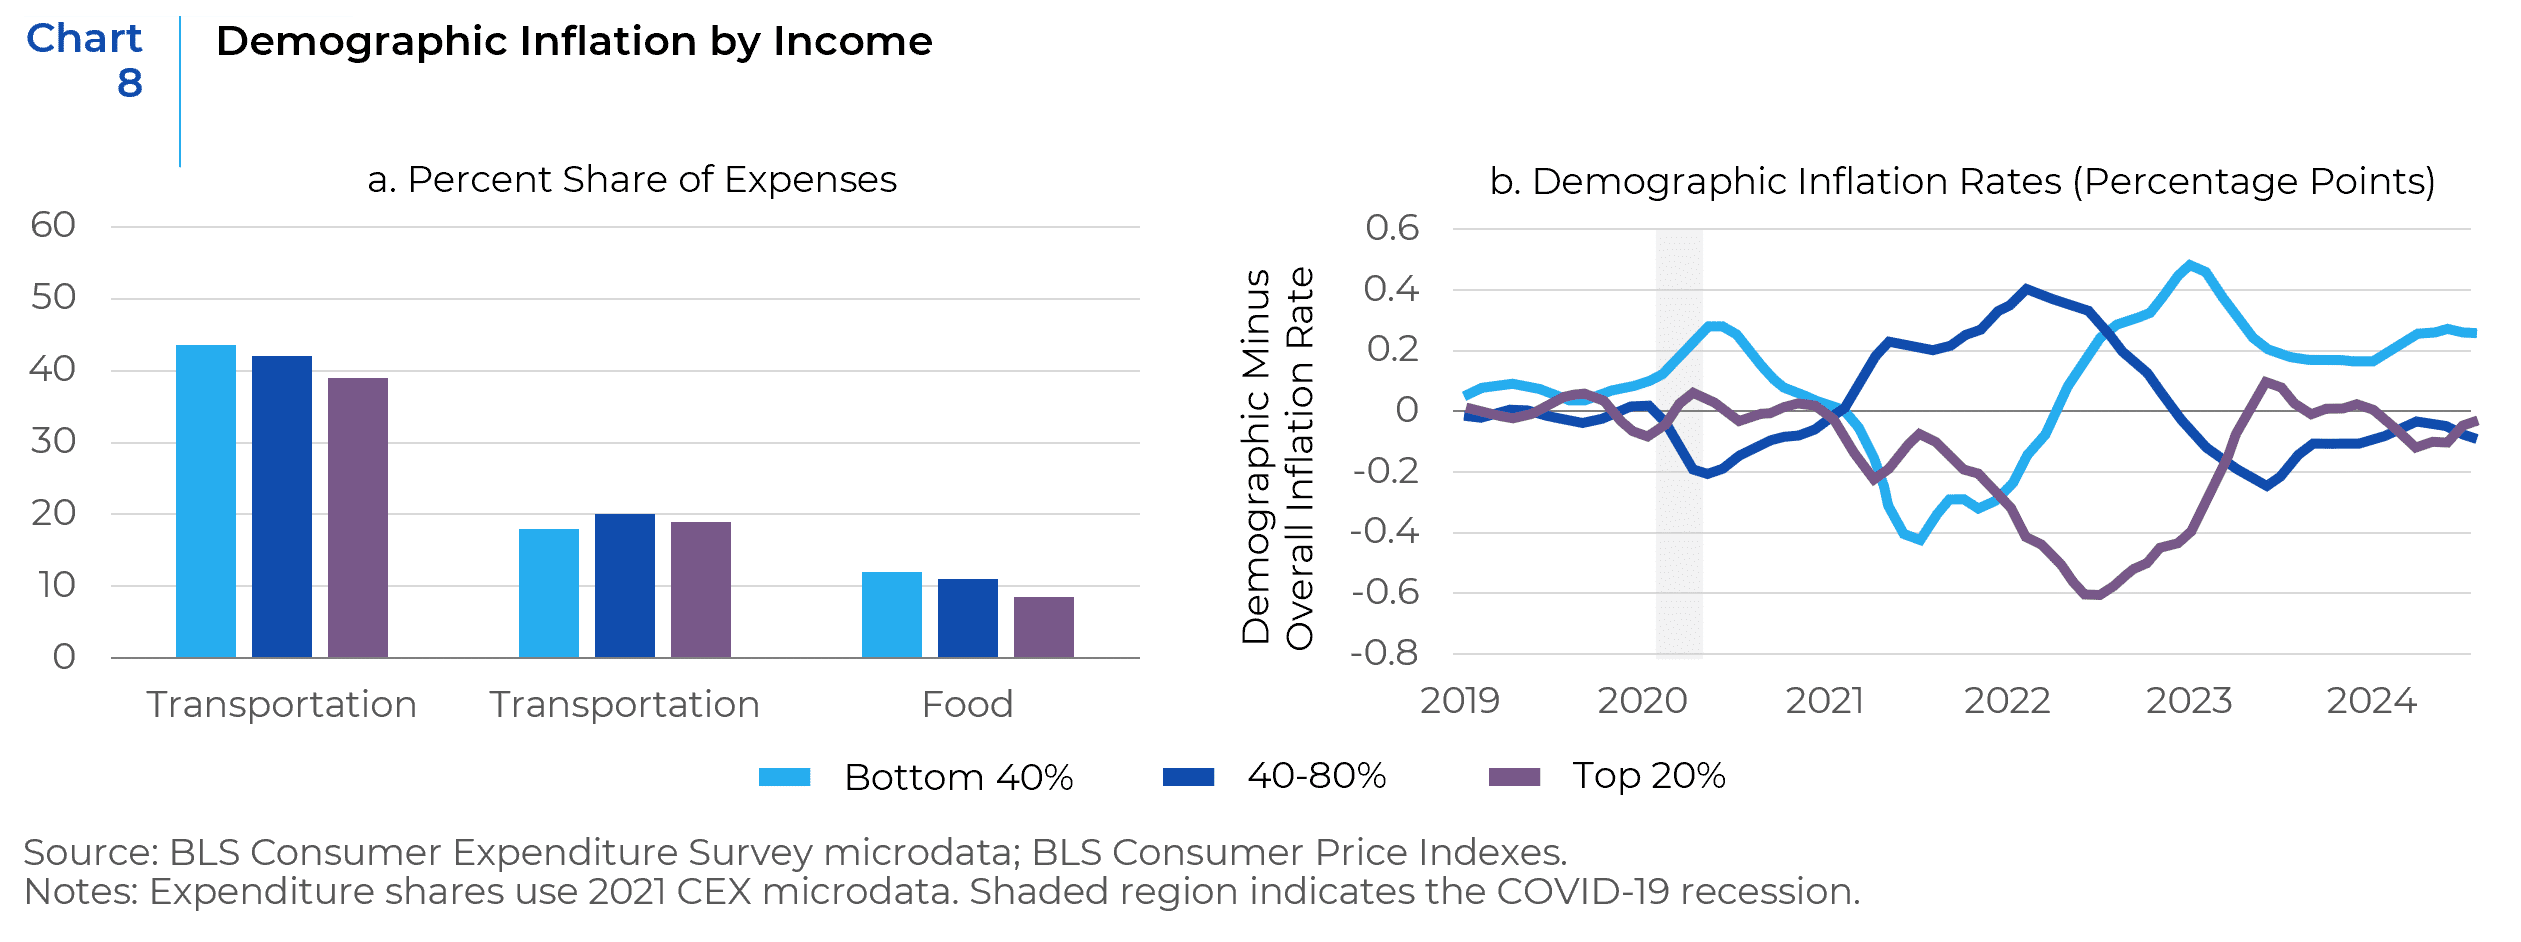
During and after the pandemic, this disparity in the effects of inflation worsened because the average consumption basket of middle- and lower-income households was most exposed to the goods and services that experienced the steepest price increases. In the first year of the pandemic, prices rose the most for lower-income households because of surging food inflation. When the price of gasoline and durable goods began to rise in 2021, middle-income households who devote a higher share of budgets to transportation began to experience much higher inflation rates, especially when microchip shortages drove up the price of new and used cars and the war in Ukraine sent gas prices to historic highs. By mid-2022, sustained growth in the cost of rent, renters’ insurance, and home prices (tracked by the BLS via “owner-equivalent rent”) led to low-income households – who are more likely to rent than own their homes— again experiencing the highest rates of inflation. By contrast, the highest-income households enjoyed below-average inflation through the worst of the post-pandemic surge (see Charts 8a and 8b).
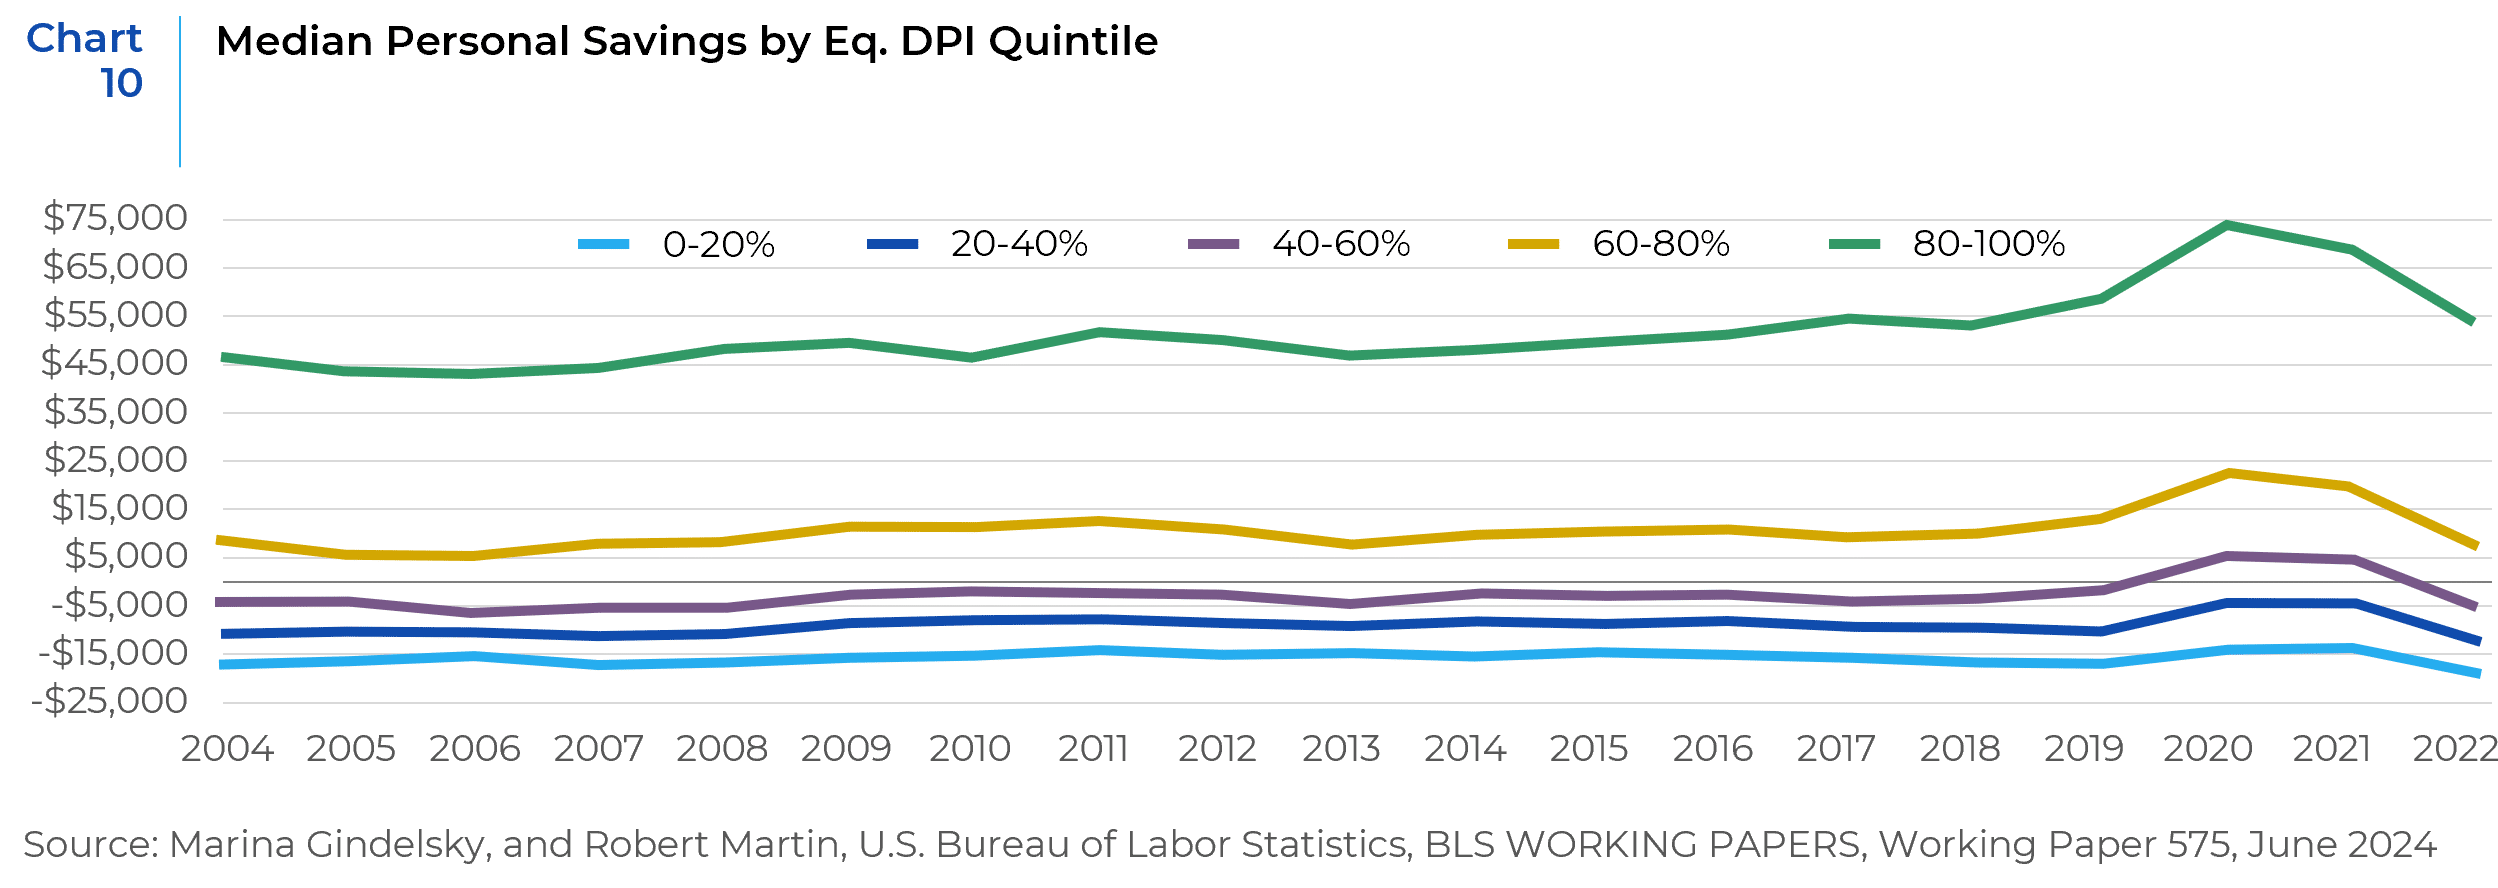
As a result of these changes, in 2022, 60 percent of Americans faced personal consumption expenditures (PCE) that exceeded their disposable income (DPI), (see Chart 9). The “average” household (40-60% percentile of Disposable Income) went from saving $5,000 per year in 2020 and 2021 to spending over $10,000 more than they earned, while the highest income household quintile was still able to save $55,000 (though down from $75,000 previously), (see Chart 10).

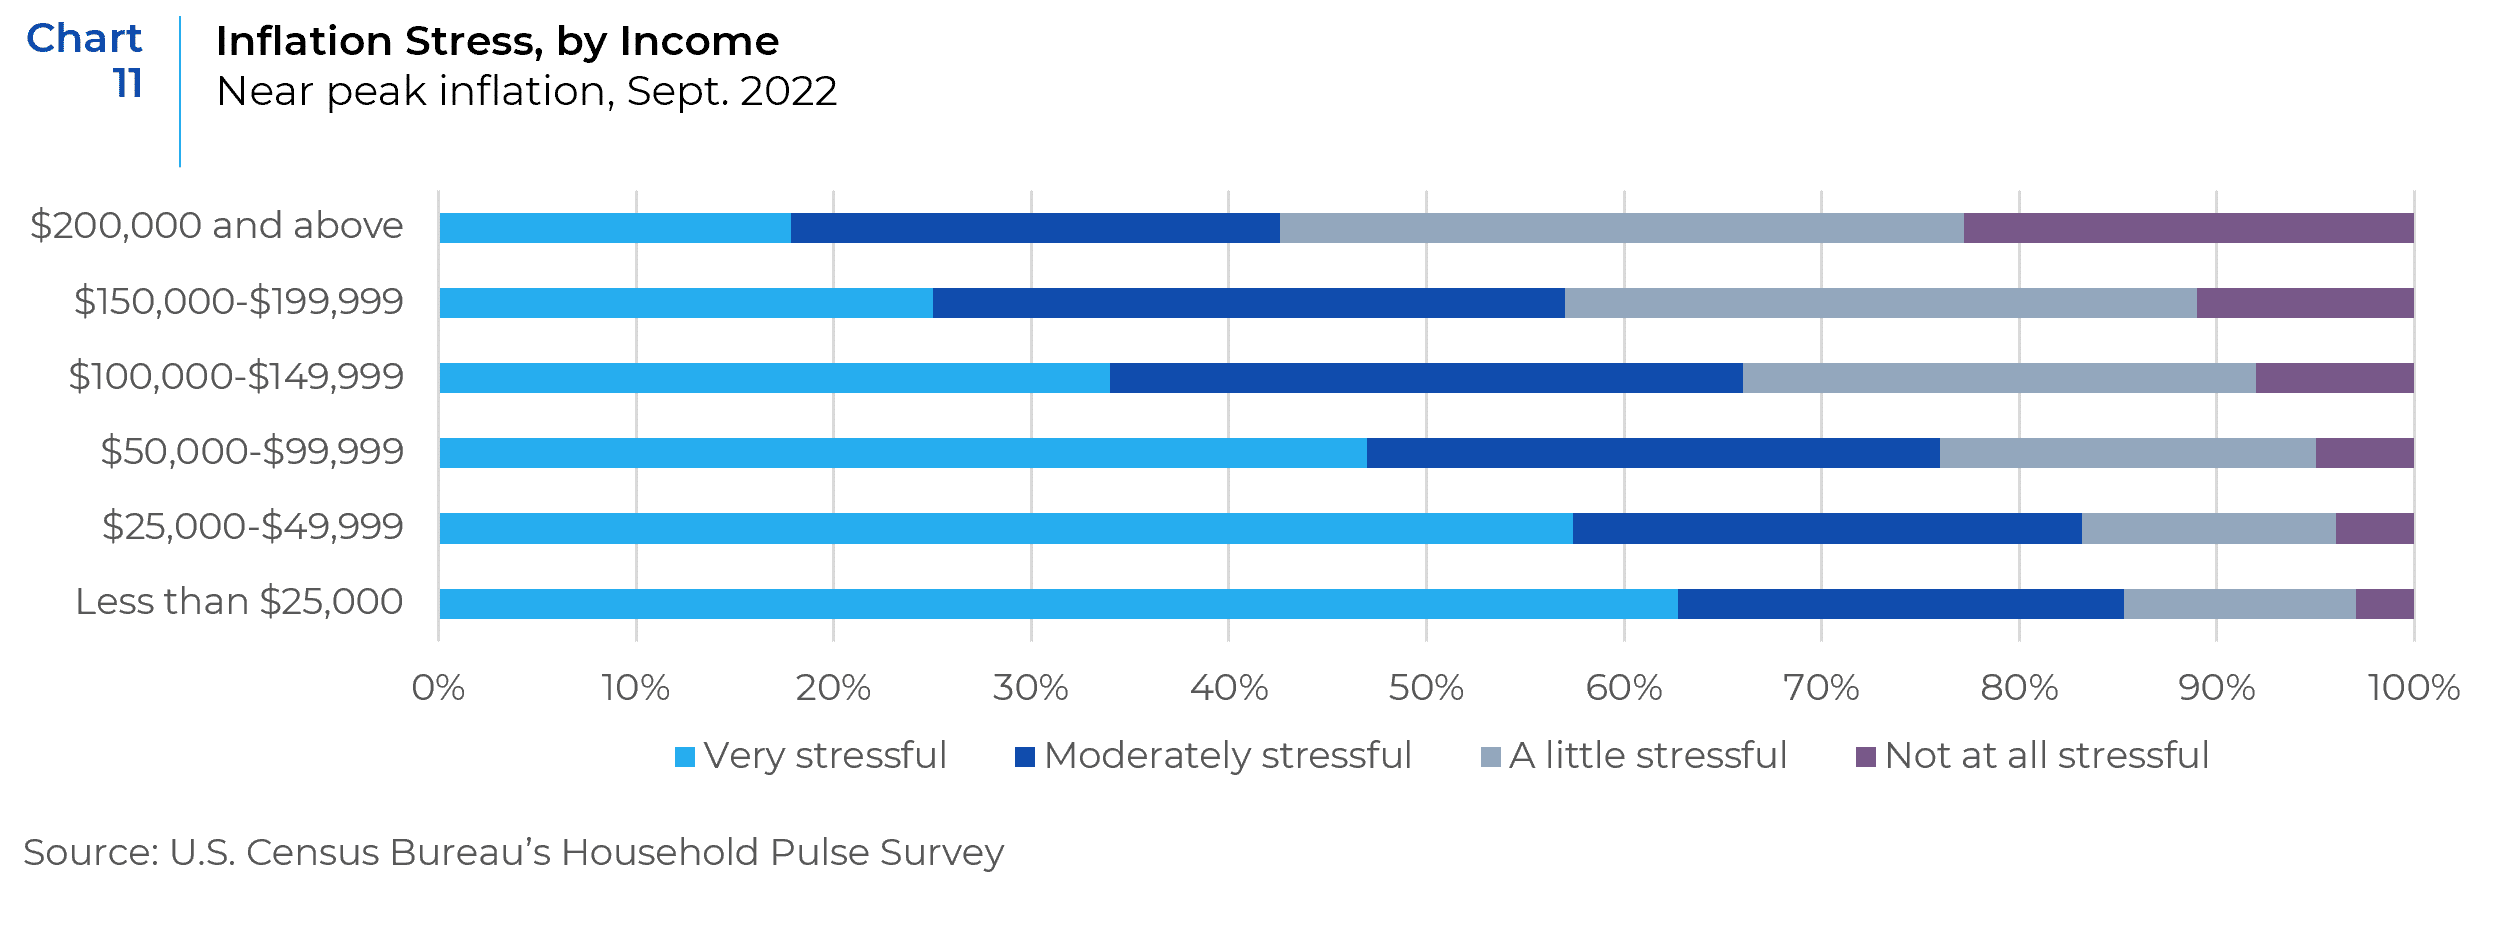
In September 2022, the U.S. Census Bureau’s Household Pulse Survey asked: What is the level of stress caused by the increase in prices in the last two months? Over 50 percent of households that earned less than $50,000 stated that inflation was “very stressful”, and almost 50 percent of households earning between $50,000 and $99,999 thought that inflation was “very stressful”. In contrast, less than 30 percent of households earning between $150,000 and $199,999 and less than 20 percent of households earning over $200,000 felt that inflation was “very stressful”. Another 20 percent in the highest quintile said that inflation was “not at all stressful” (see Chart 11).
It is therefore unsurprising that in 2024, President Trump definitively increased the Republican Party’s support among low-income voters. He picked up 10% more voters in the $30,000-$49,999 income threshold and 9 percent more for the $50,000-$99,999 group than in 2020. The lower income gain was novel, because he had not done well with this cohort in either 2016 or 2020. For the $50,000 to $99,999 cohort, Trump’s gains in 2024 recovered from his 2020 failure. Vice President Harris failed to match Joe Biden’s performance with this critical middle-class group, while lagging both Clinton and Biden in the lower two cohorts. She did, however, pick up voters in the upper income cohorts, outperforming both Clinton and Biden. Unfortunately for Harris, these income cohorts are not as populous as the middle classes.
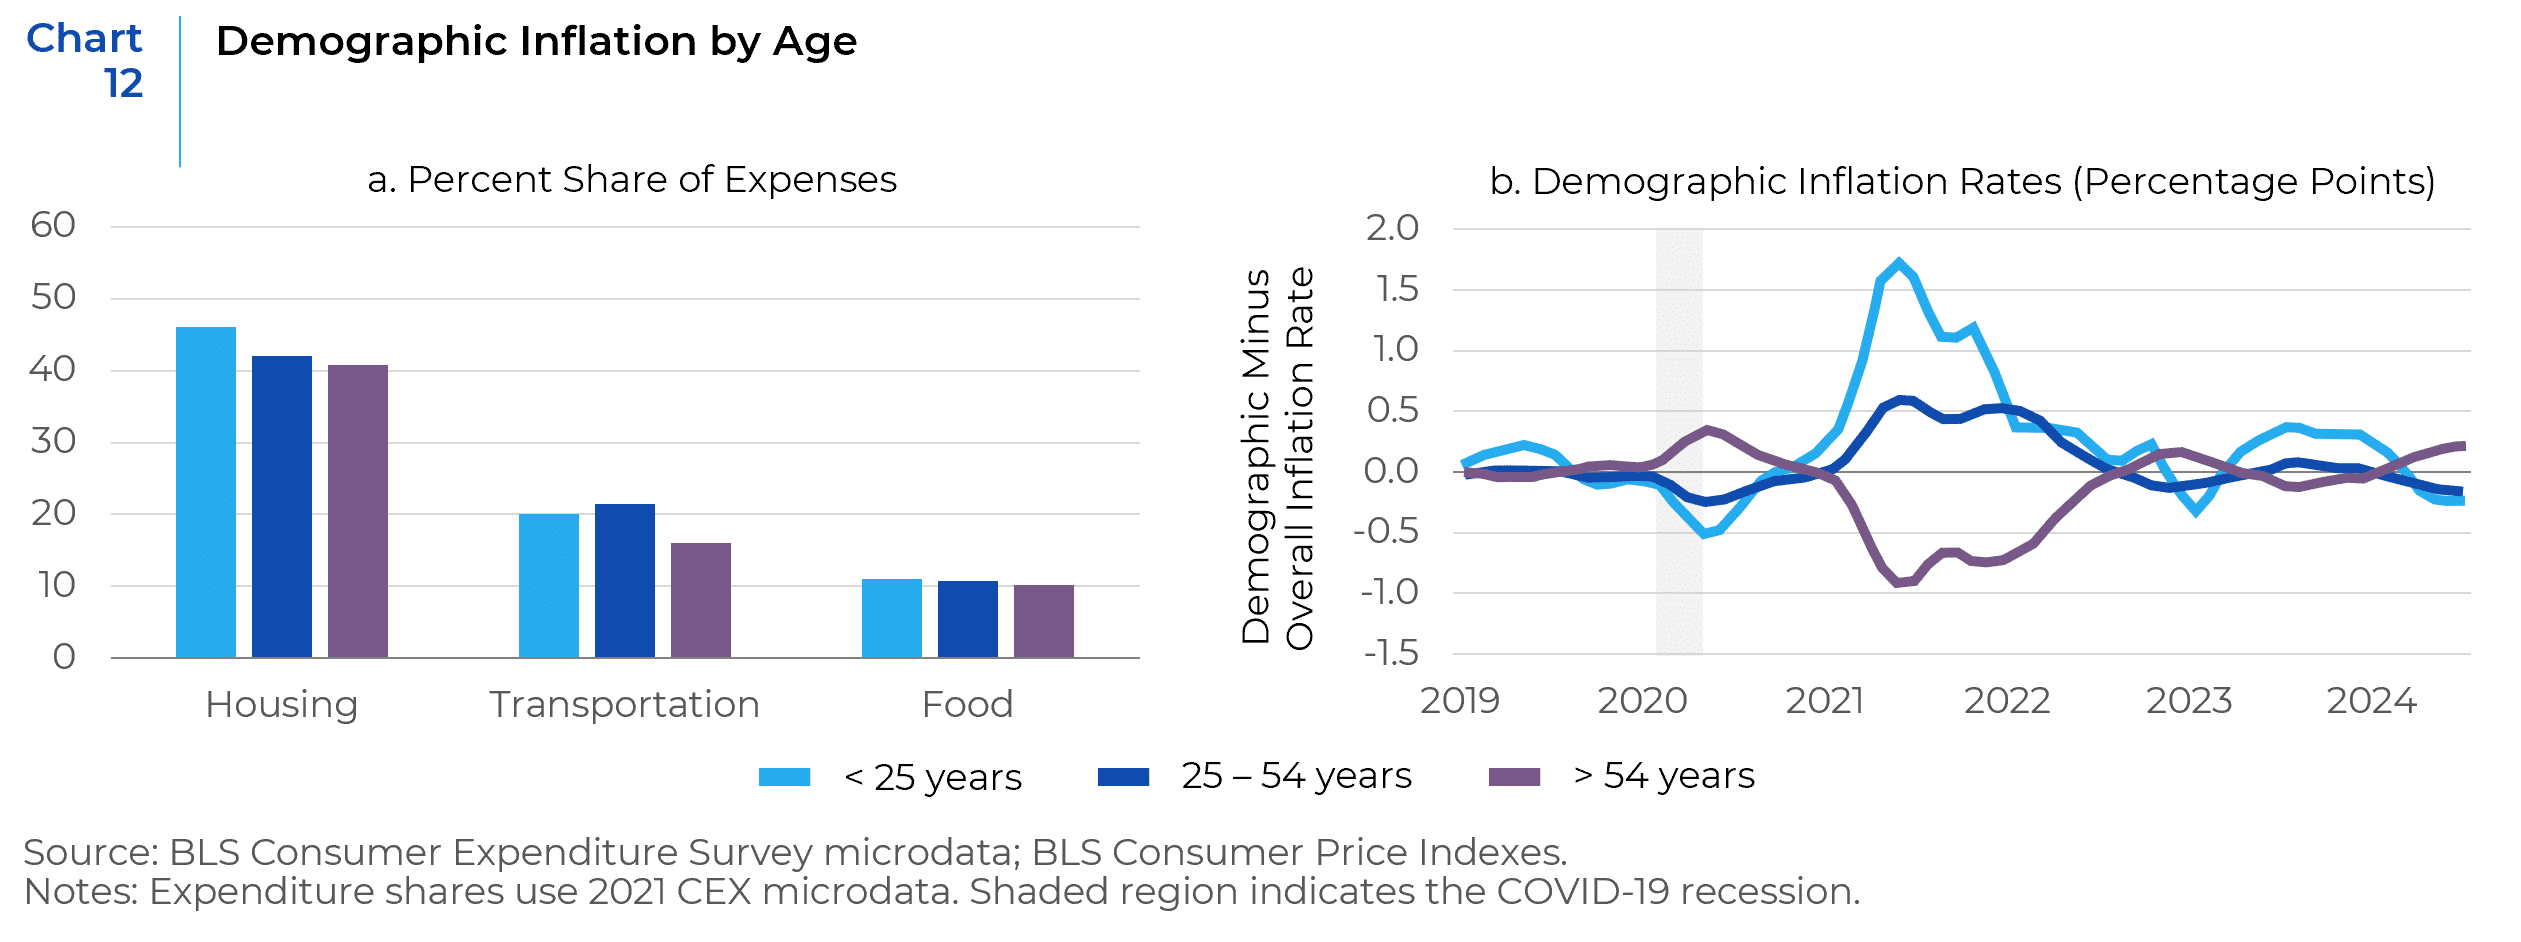
In addition to picking up more voters in the middle- and low-income cohorts, President Trump reversed decades of poor Republican Party performance with young voters. The New York Fed’s Equitable Growth Indicators suggest that younger voters, whose average consumption basket is especially exposed to the cost of housing and food, were disproportionately hurt by inflation (see Charts 12a and 12b). In 2024, young voters (defined here as ages 18 to 29), favored Kamala Harris over Donald Trump, 52 percent to 46 percent. Yet they showed a notable shift toward Trump compared to how they voted in 2020. Moreover, the overall youth turnout was lower than in 2020. Almost 50 million young people were eligible to vote in the 2024 election; but according to the exit poll data, about 42 percent of them voted. That percentage was lower than the historic turnout seen in 2020, which CIRCLE estimated at 52-55 percent.[1]
While gender was the primary fault line along which both candidates tailored their messaging, they also targeted voters among the United States’ major racial categories. Post-election results show that Harris won among most racial minorities; but Trump gained among Latino voters by more than 10 percentage points (and 18 percent among Latino men) compared to 2020.
Though there are many non-inflationary factors (such as race and gender bias, as well as religious/social values) that influenced the election’s results, it is also likely that inflation’s disparate effect by racial category contributed to the election’s results. The New York Fed data shows that the consumption basket of Hispanic households was especially sensitive to transportation and food prices. This is why they were disproportionately affected by rises in the cost of those goods in 2021 and 2022 (see Charts 13a and 13b). Accordingly, in polls, Latinos consistently put economic issues at the top of their list of concerns. After the election, the media was full of voters reaffirming this. As one Pennsylvania voter of Puerto Rican descent told NBC News, he wasn’t bothered by Trump’s comments about the island: “For me, it’s work. It’s the economy. It’s groceries.”
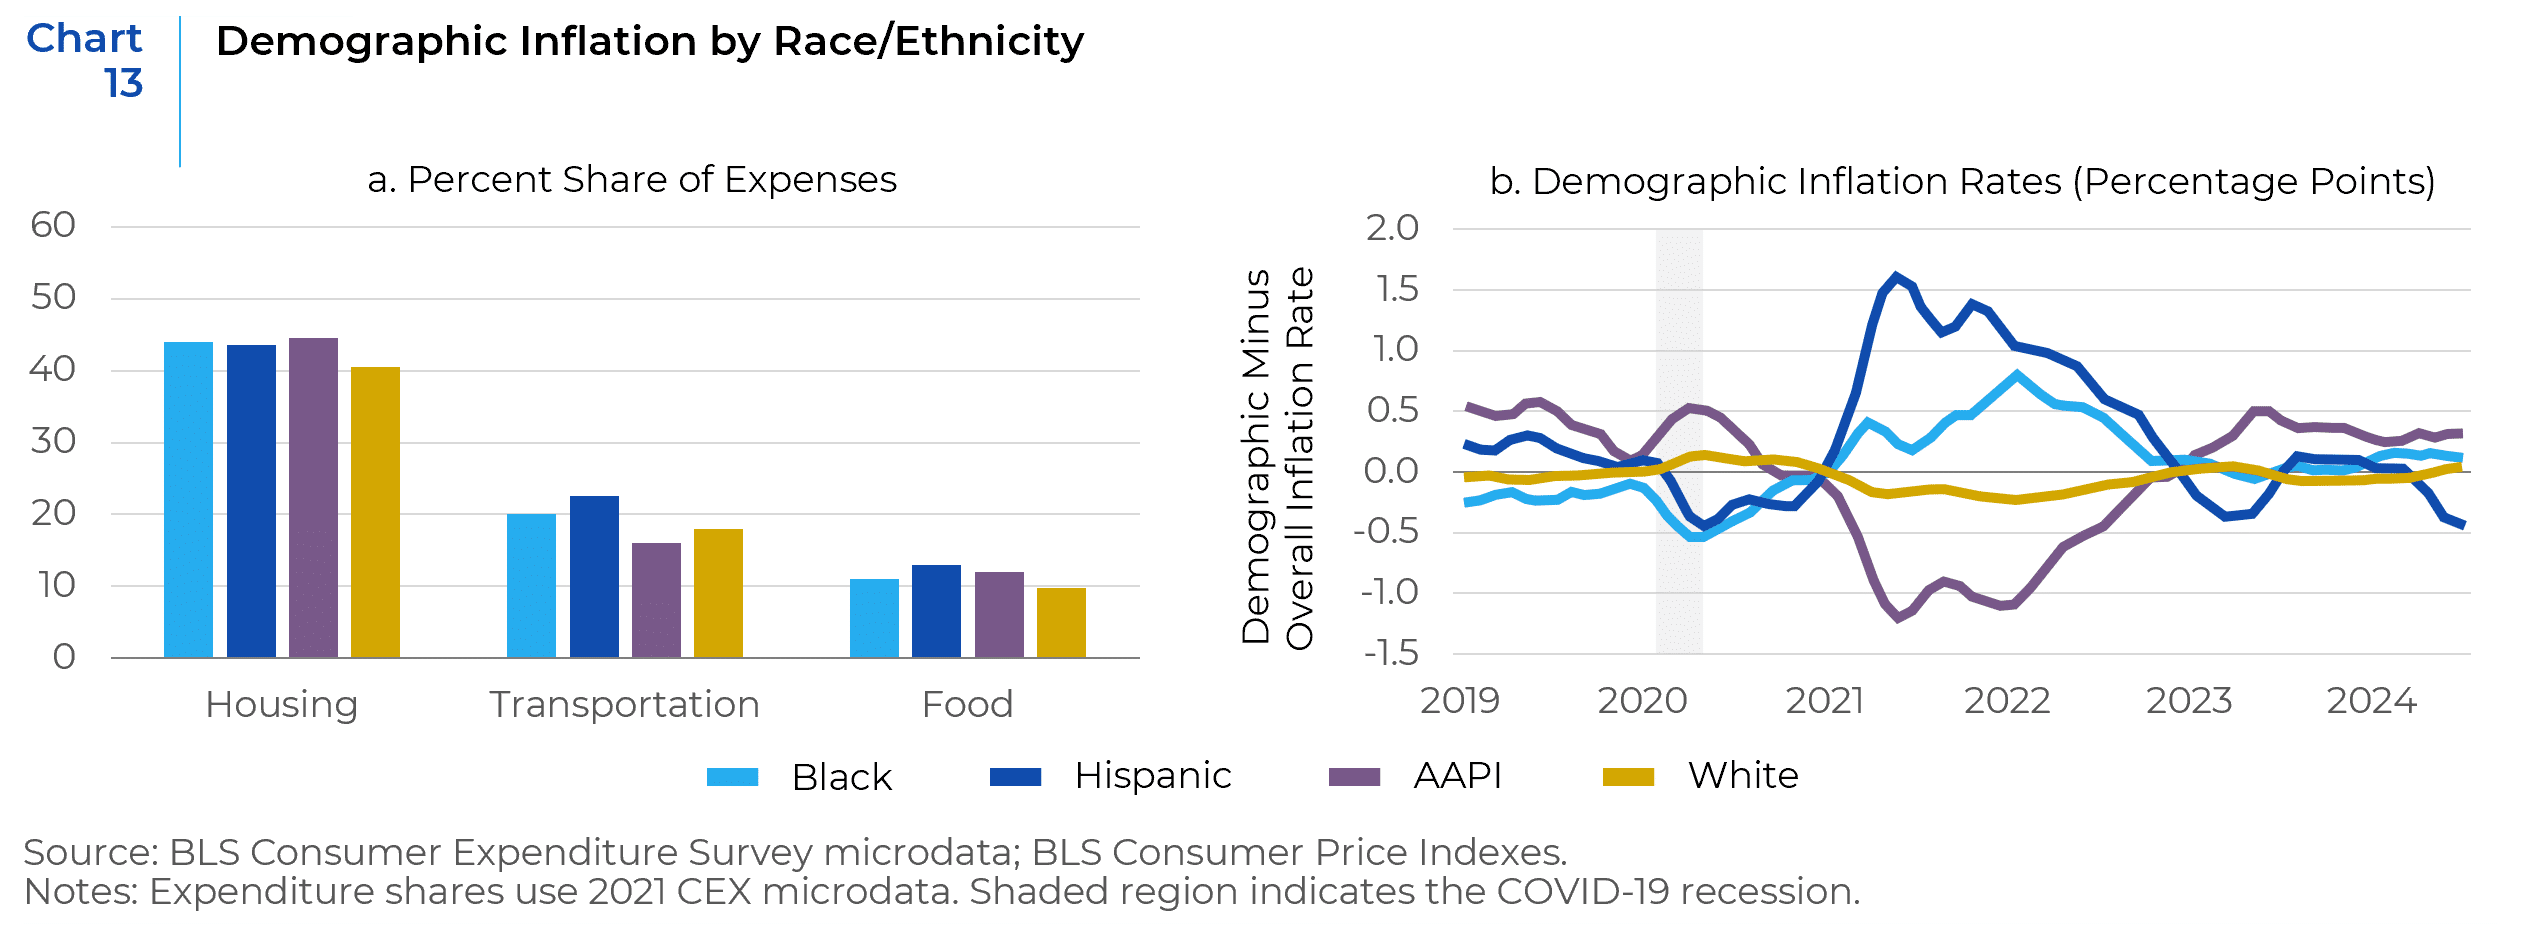
Black Americans were the second most affected group by spiking transportation and food inflation after 2021. They are also more exposed to rent inflation than any other racial group. Fewer than half of Black and Hispanic households own homes vs. 75 percent of white households. Barring any local limits, rents can be increased as often as a lease allows (or any time tenancy changes), while payments on a fixed mortgage secured during the relatively low-interest rate pre-pandemic period never budged. After 2022, rent inflation catalyzed another spike in inflation. This is partially why Black households suffered the most severe inflation in 2023. So, one might fairly ask, why did Harris not lose ground among them? The answer is that inflation was not the only factor that drove voting preferences. One writer from The Atlantic proffered the following:
“The civil-rights movement was painstakingly built by exploiting America’s political rights to assembly and free speech. When Black Americans in the North couldn’t buy homes because of redlining, many could still—despite obstacles—vote. Perhaps Black voters understood better than many Latino voters an essential truth: Access to the American dream is elusive, but America’s freedoms are indispensable.”[2]
Going forward, the real issue for all voters is whether the new administration’s policies will address the concerns highlighted in this paper as well as other pressing concerns. Because thus far, the durability of the anti-incumbent movement reflects the failure of their chosen leaders to address the issues faced by the working class. It also reflects an ongoing failure of political and economic leaders as well as the media, to clearly articulate what drove the forces that are increasingly challenging working families’ ability to fully take part in our changing world, and to provide objective and accessible forums for vetting the efficacy of policies proposed by competing candidates.
Part II of this series will examine factors affecting immigration policies, while Part III will evaluate solutions and their investment implications.
—
[1] Center for Information & Research on Civic Learning and Engagement (CIRCLE), the non-partisan research center on youth engagement at Tufts University’s Jonathan M. Tisch College of Civic Life
[2] Xotchitl Gonzales, staff writer for the Atlantic. “Why Did Latinos Vote for Trump?”.
This report is neither an offer to sell nor a solicitation to invest in any product offered by Xponance® and should not be considered as investment advice. This report was prepared for clients and prospective clients of Xponance® and is intended to be used solely by such clients and prospective clients for educational and illustrative purposes. The information contained herein is proprietary to Xponance® and may not be duplicated or used for any purpose other than the educational purpose for which it has been provided. Any unauthorized use, duplication or disclosure of this report is strictly prohibited.
This report is based on information believed to be correct but is subject to revision. Although the information provided herein has been obtained from sources which Xponance® believes to be reliable, Xponance® does not guarantee its accuracy, and such information may be incomplete or condensed. Additional information is available from Xponance® upon request. All performance and other projections are historical and do not guarantee future performance. No assurance can be given that any particular investment objective or strategy will be achieved at a given time and actual investment results may vary over any given time.

