After President Trump won the 2024 election, market expectations of continued U.S. economic and financial exceptionalism went into hyper-drive. At the beginning of 2025, U.S. Stocks traded at 21.6x forward earnings that are projected to grow by 16% vs. 10% at the beginning of 2024. Most of the earnings acceleration is back-end loaded for H2, when promises of lighter tax and regulatory burdens are expected to turbocharge earnings. Bond investors have, however, been more circumspect and appear to be pricing in increased uncertainty over the long-run inflationary effects of the Trump policy platform. Though the Fed cut rates by 100 bps beginning last September, the 10-year Treasury yield rose by more than 100 bps by year end. By mid-December, these fears began to weigh on the stock market.
We acknowledge that “it depends” is an unsatisfactory answer. But as the shifting market narrative described above shows, national policy choices could lead to drastically different economic and market outcomes. Below is a summary of the scenarios, our beliefs on the most likely outcomes, and their economic and financial effects.
- Full implementation of the Trump platform would worsen the U.S.’s fiscal position, increase its debt burden and inflation; thus undermining U.S. financial exceptionalism. But…
- Trump’s maximalist platform will likely be curbed by the following three factors:
-
- The U.S.’ precarious fiscal and debt dynamics.
- The prospect of a “Liz Truss” like bond riot (previewed by the mid-December rise in bond yields) which would knee-cap stocks and other risk assets, and
- Voter sensitivity to inflation, which could stiffen the spines of an otherwise pliant U.S. Congress.
- A constrained Trump (our base case) would implement both mass deportation and tariffs at the lower end of policy estimates, and any tax cuts will be marginal. This version could extend the U.S.’ current economic and financial exceptionalism.
- As in the past, the market is overestimating the long-term economic benefits of tax cuts. Neither the Bush or Trump’s 2017 tax cuts led to a sustained improvement in business investment or economic growth. They also did little to improve the lot of the working class and thus are unlikely to address their disaffection with the four decades of neoliberal policies (perpetuated by both right and left leaning parties) that, as discussed in the Inset in Part 1 of this series, left them behind.
This piece is the third in a three-part series on the issues that led to 2024’s anti-incumbent party backlash. The first two parts focused on the two issues that, according to exit polls, drove advanced economy voter preferences in 2024: Inflation (The Precariat Are Still Mad – An Analysis of 2024’s Incumbent Party Shellacking) and Immigration (The Precariat Are Still Mad! Real Talk on Immigration). Here, we evaluate the trade and other fiscal proposals put forward by the incoming Trump administration, as well as their investment implications. For a deeper dive on both their investment implications and proposed investment responses, we have hyperlinked the outlooks provided by our team of seasoned asset class experts in the U.S. equities, U.S. fixed income, and global markets.
“Tariff is the most beautiful word in the dictionary.”
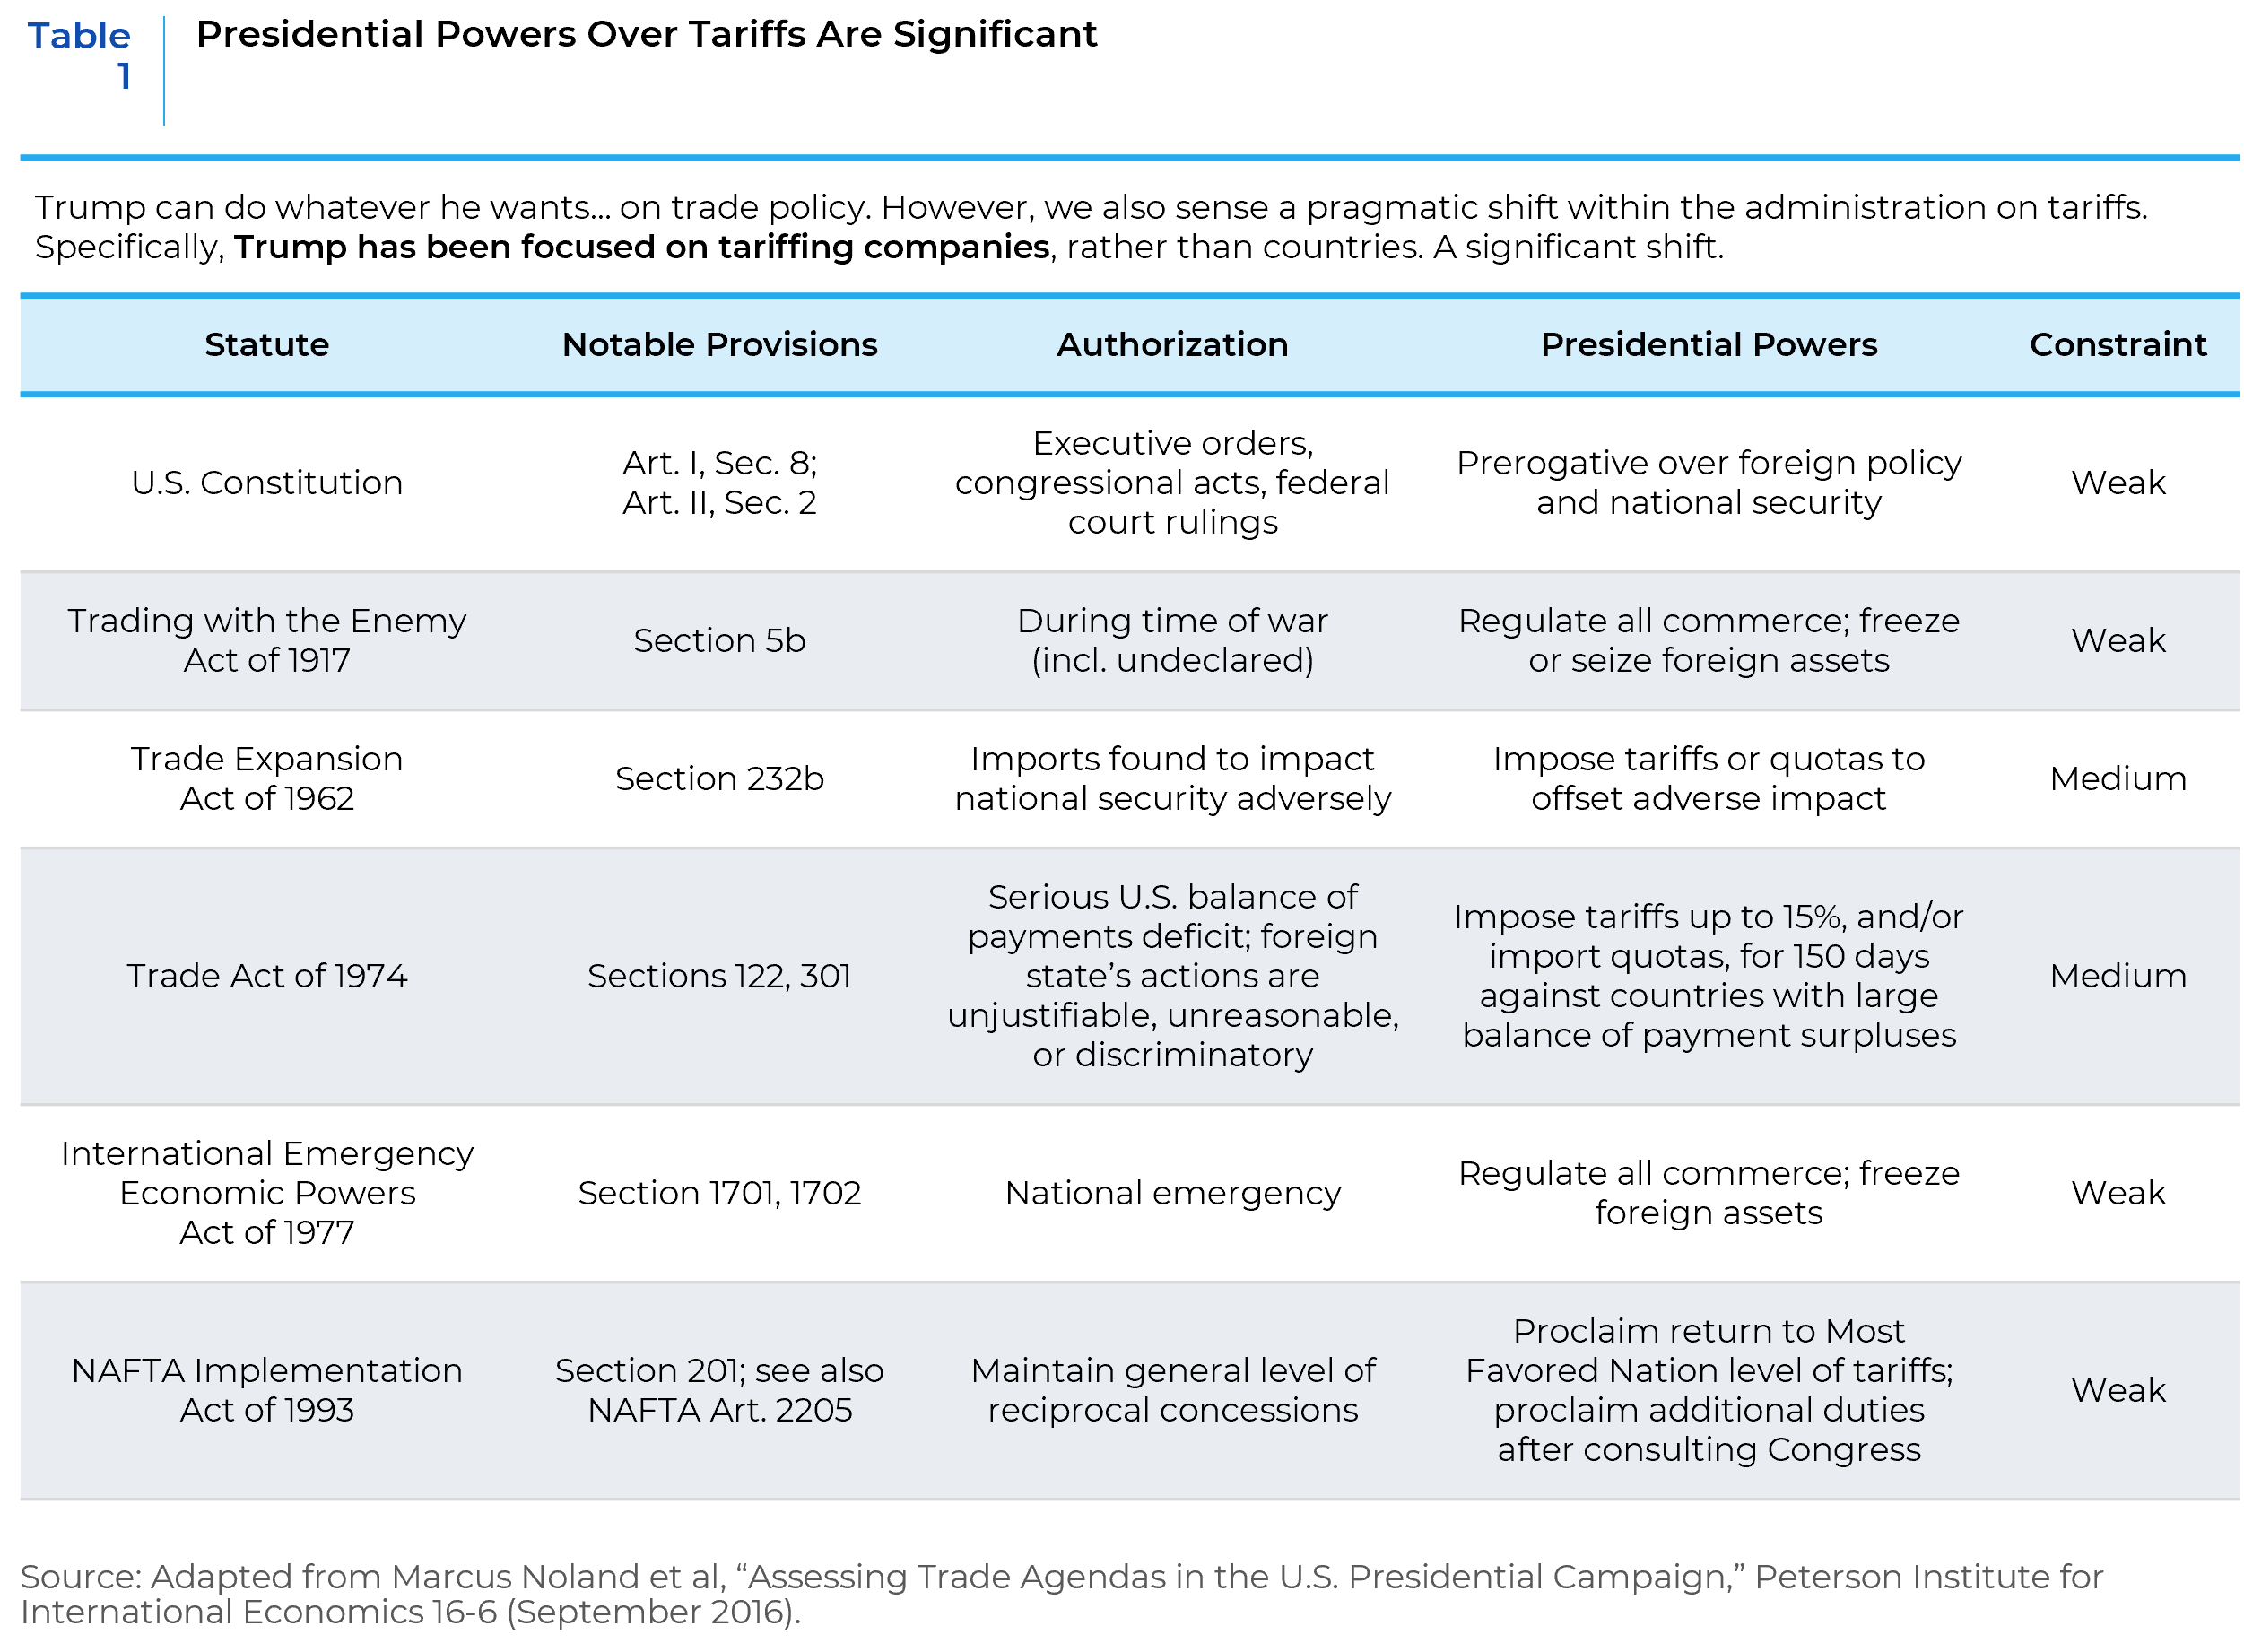
President Trump’s vow to impose tariffs on “countries that have taken advantage of the U.S. for years,” was a cornerstone of his campaign. When enumerated, though varying in size and scope from speech to tweet, the median outer limits of these tariff proposals were 20% on all imports, 25% on all products from Mexico and Canada and 60% on goods entering from China. It is important to note here that Trump’s authority over tariff policy is nearly unfettered (see Table 1).
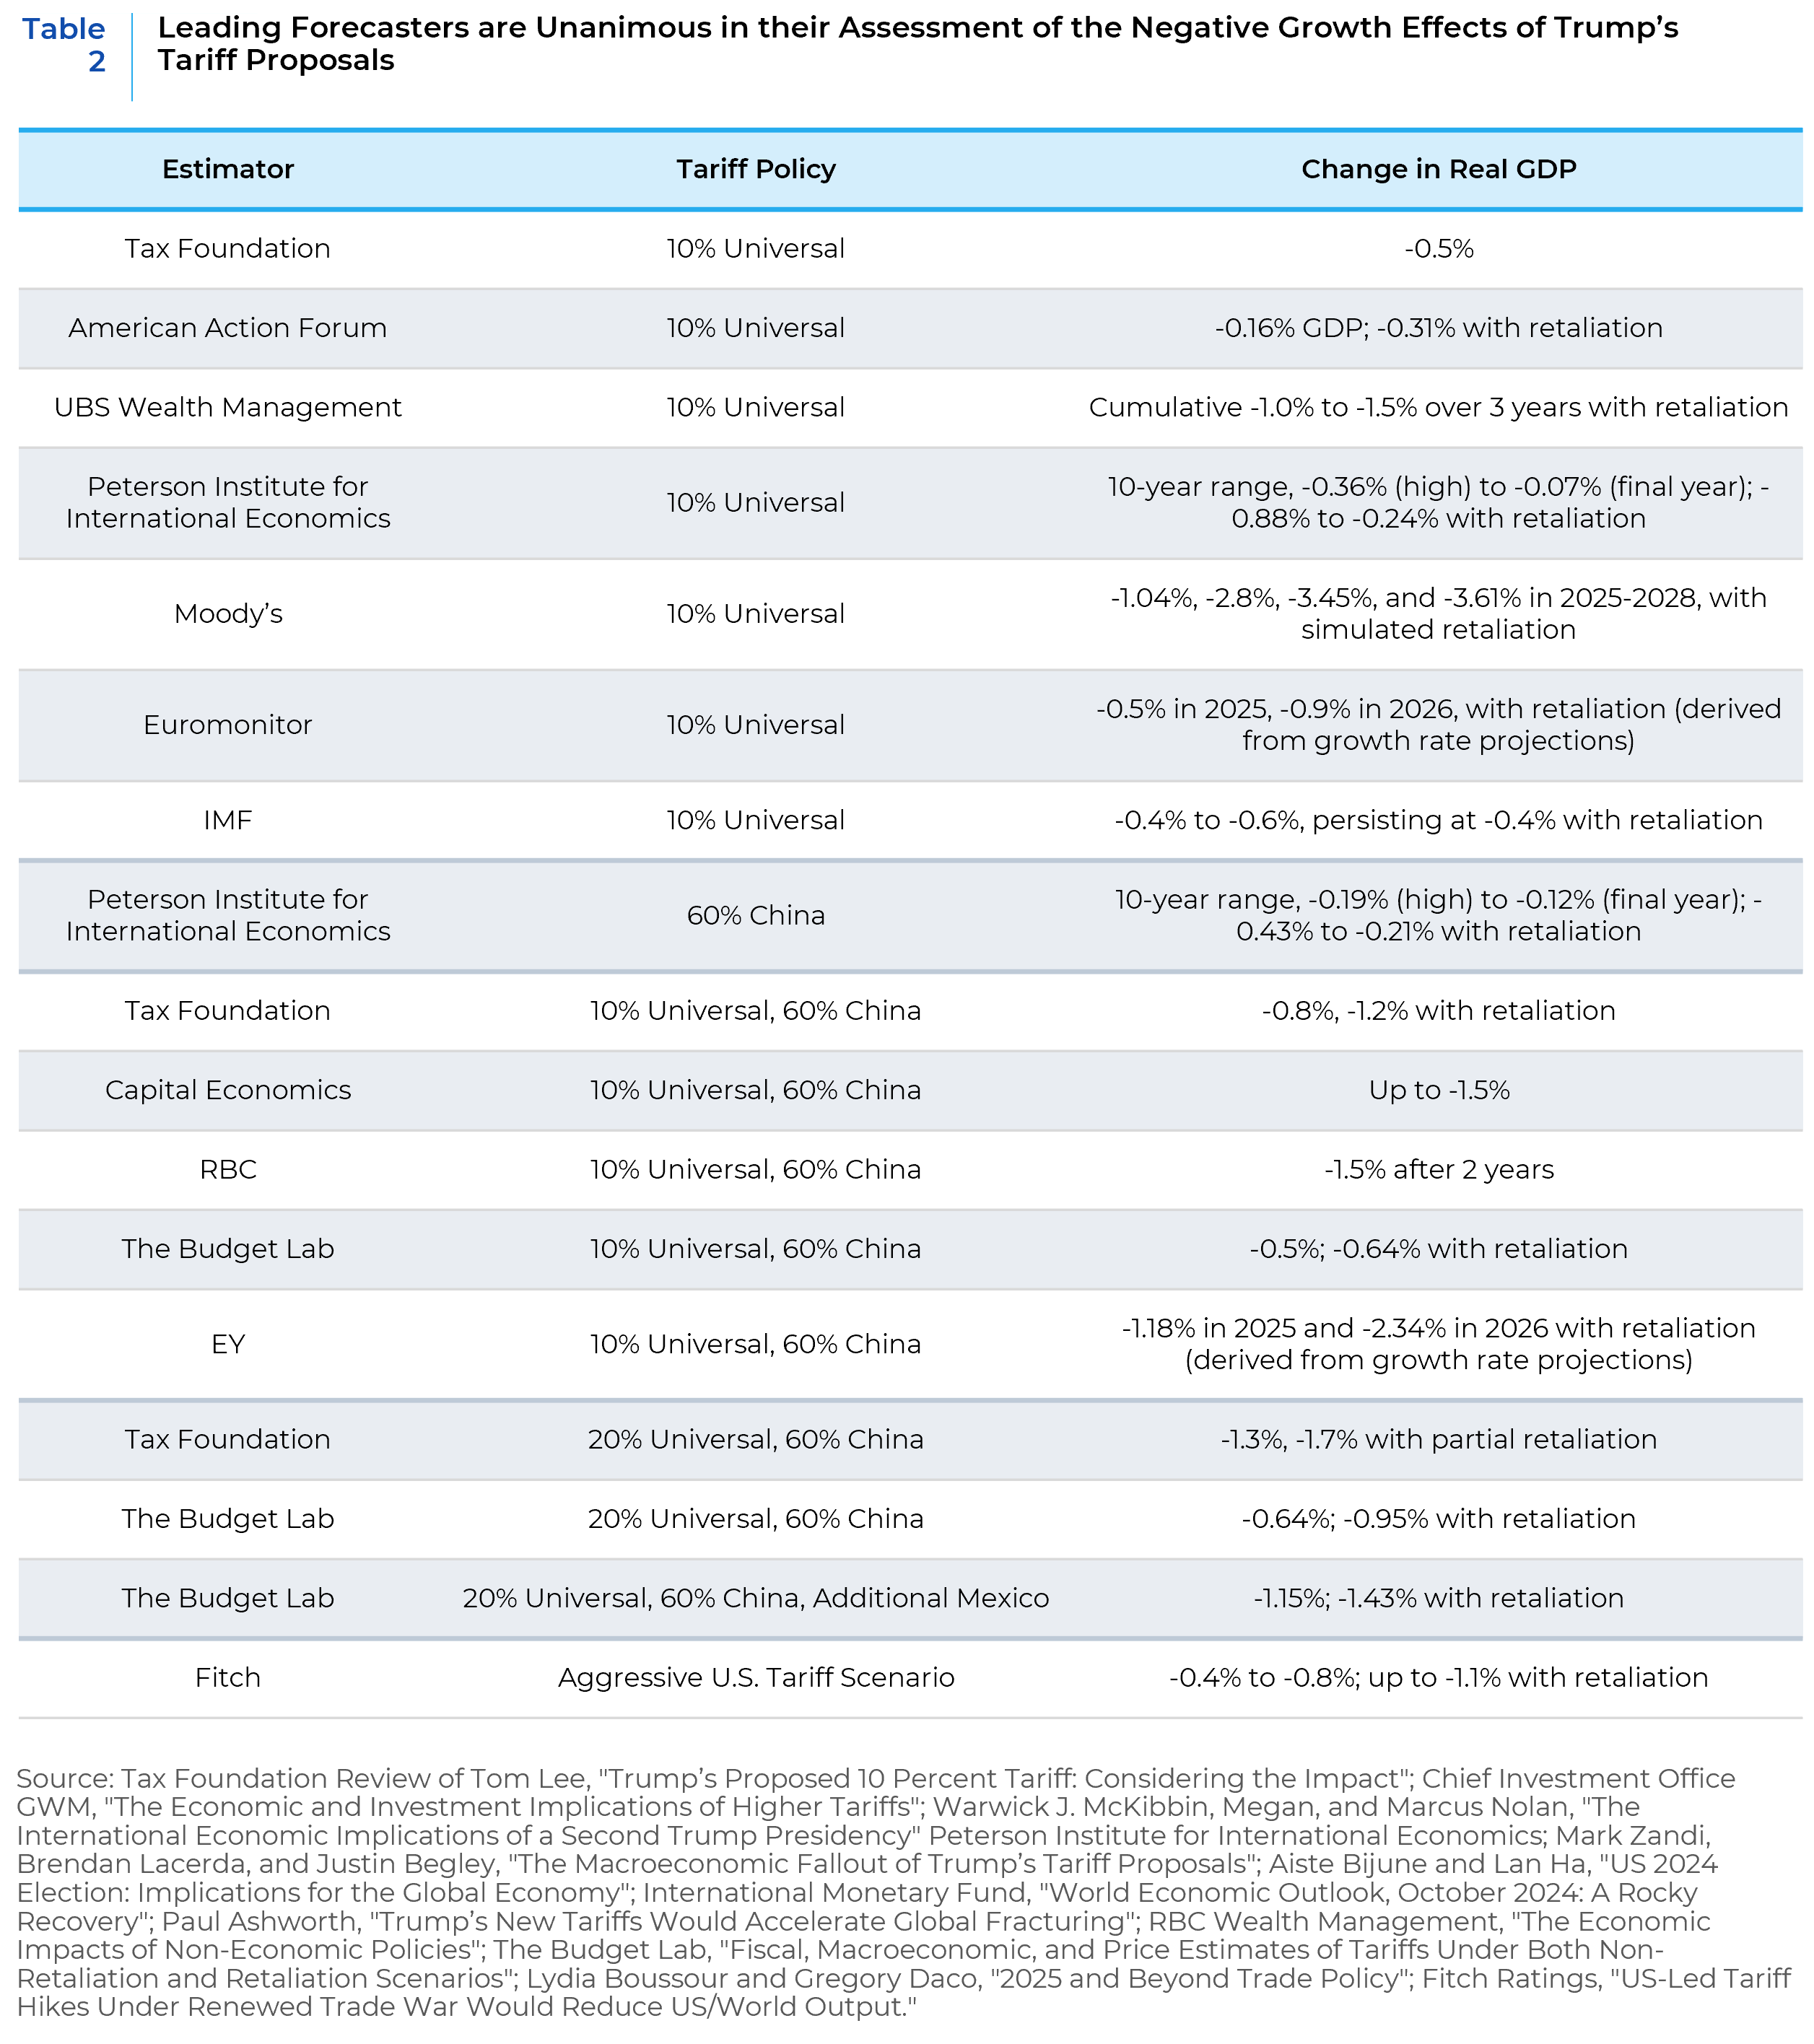
Despite Trump’s insistence that the costs of these tariffs would be borne by foreign companies and benefit U.S. consumers and manufacturers, an extensive survey of forecasters universally agree that the proposed tariffs would lower future U.S. GDP. To the extent that half of global trade is in intermediate goods, higher tariffs would effectively boost taxes on businesses and thus partially offset the earnings boost from lower taxes. Depending on various scenarios, including the retaliatory response from other countries, the haircut to the U.S.’s GDP could range between a benign (-0.12%) to the substantial (-3.6%) (see Table 2).
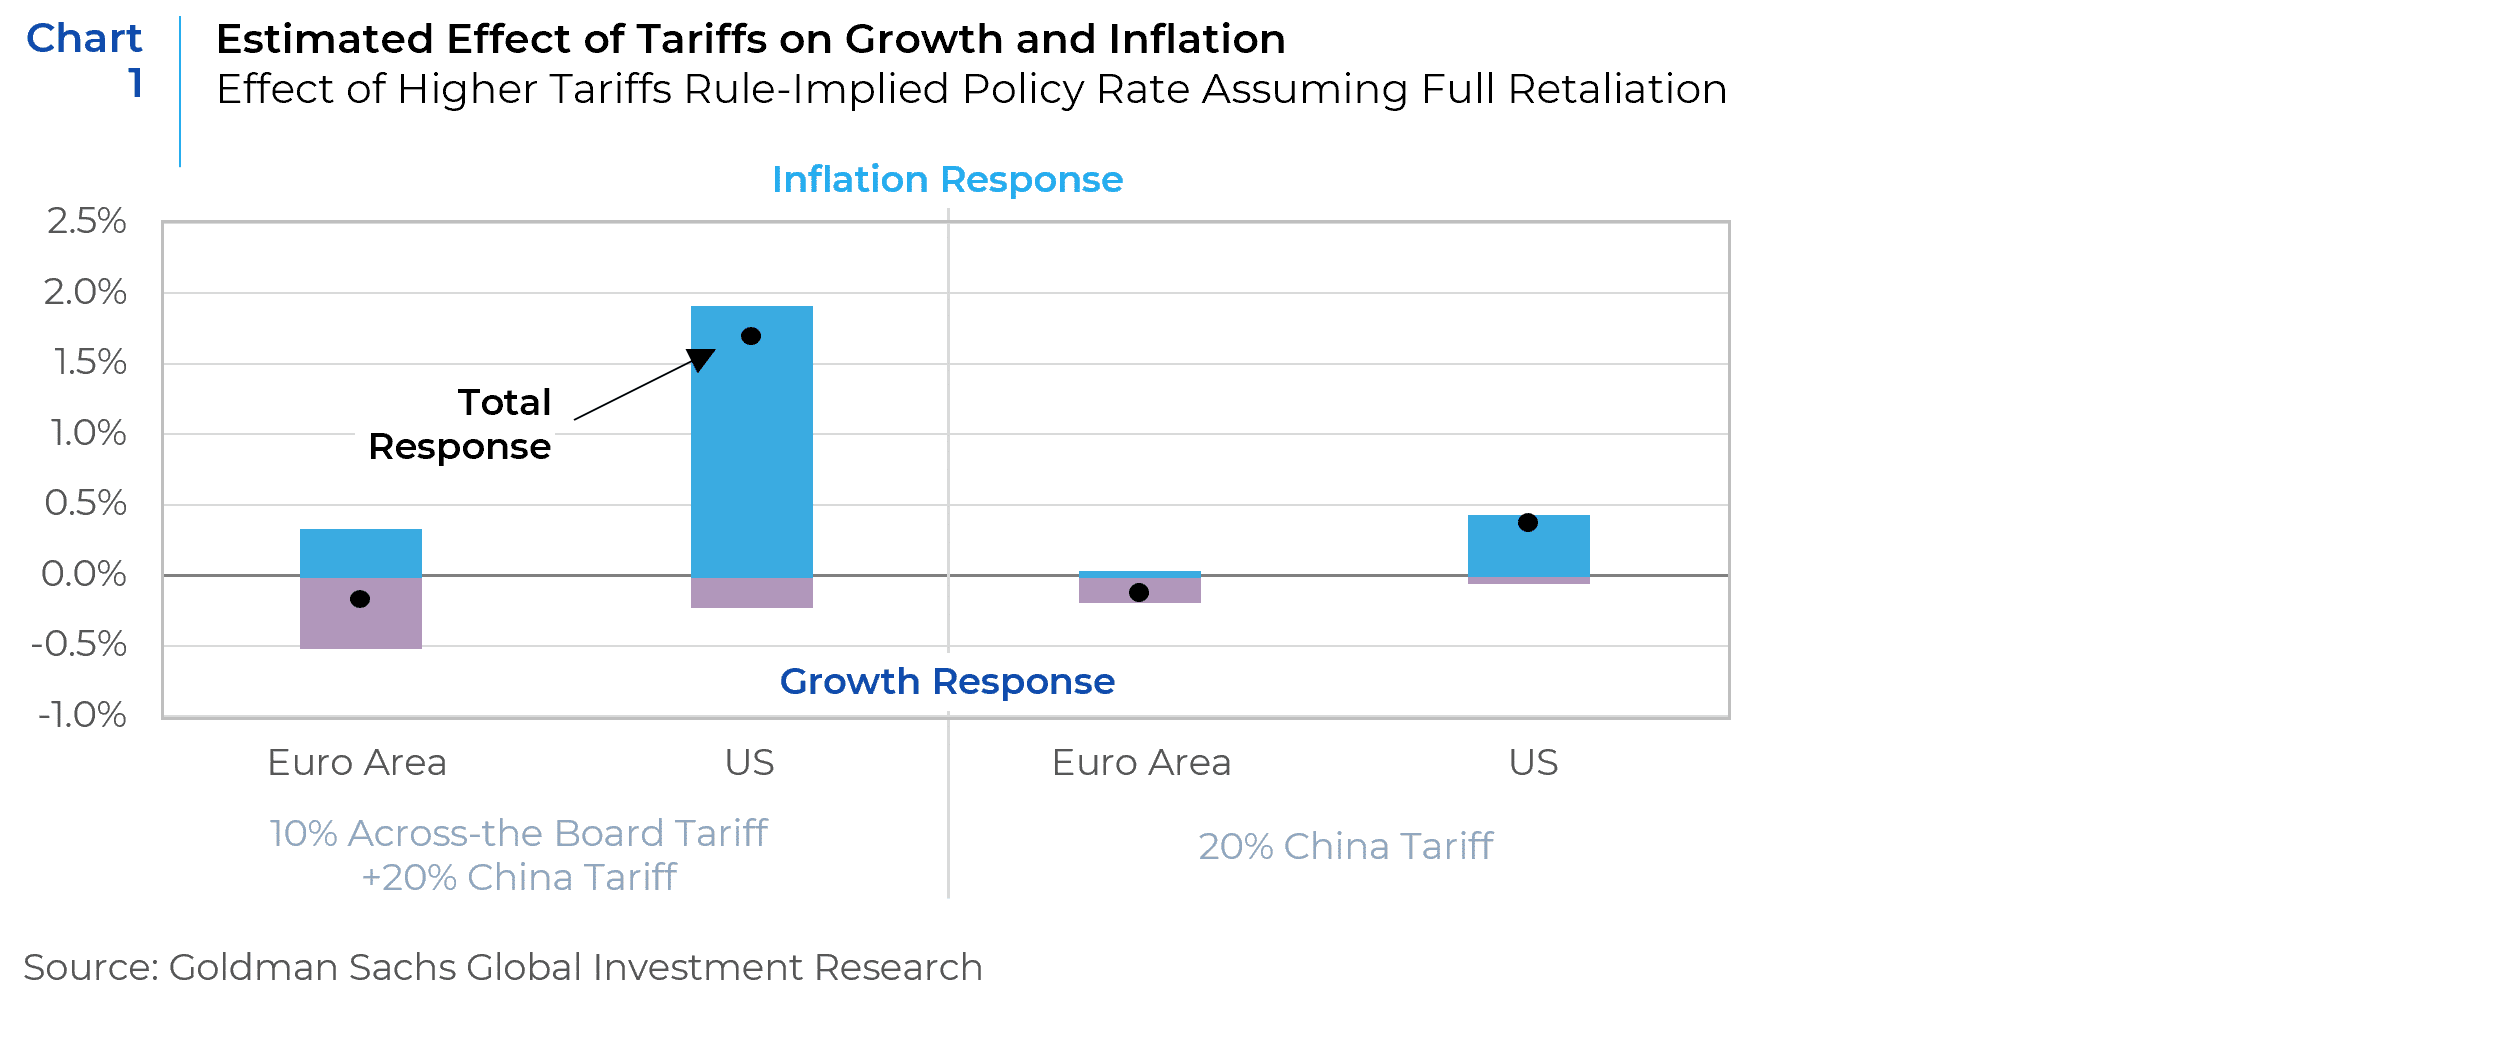
Tariffs would inevitably lead to higher prices overall, with Goldman Sachs estimating as much as a 2% bump to inflation under the scenario of a 10% across-the-board tariff, a 20% tariff on Chinese goods, and full quid pro quo retaliation (see Chart 1). In both cases, European growth would be disproportionately penalized because of the continent’s higher dependance on external trade with both China and the U.S. The U.S. exports less than it imports from other nations. Thus, tariffs would primarily transmit inflation through higher import costs.
In effect, Trump’s maximalist tariff strategy will ultimately be constrained by the reality of its’ stagflationary impact on U.S. growth. We also believe that Trump’s extreme rhetoric on tariffs is partially aimed at extracting (sometimes unrelated) concessions from trading partners. Stronger enforcement on border crosses or on reigning in Mexican cartels, for example, may fully or partially assuage the threat of tariffs on imports from Mexico. But in the interim, the U.S. economy is exposed enough to Mexico to see price rises if large tariffs are enacted both ways. The threat of tariffs on the Euro area may be assuaged by reforms to NATO and higher defense spending by European nations. But while the negotiation process plays out, elevated trade uncertainty is likely to tamp down business investment and transmit stagflation.
Deficits Are Beginning to Matter – Again
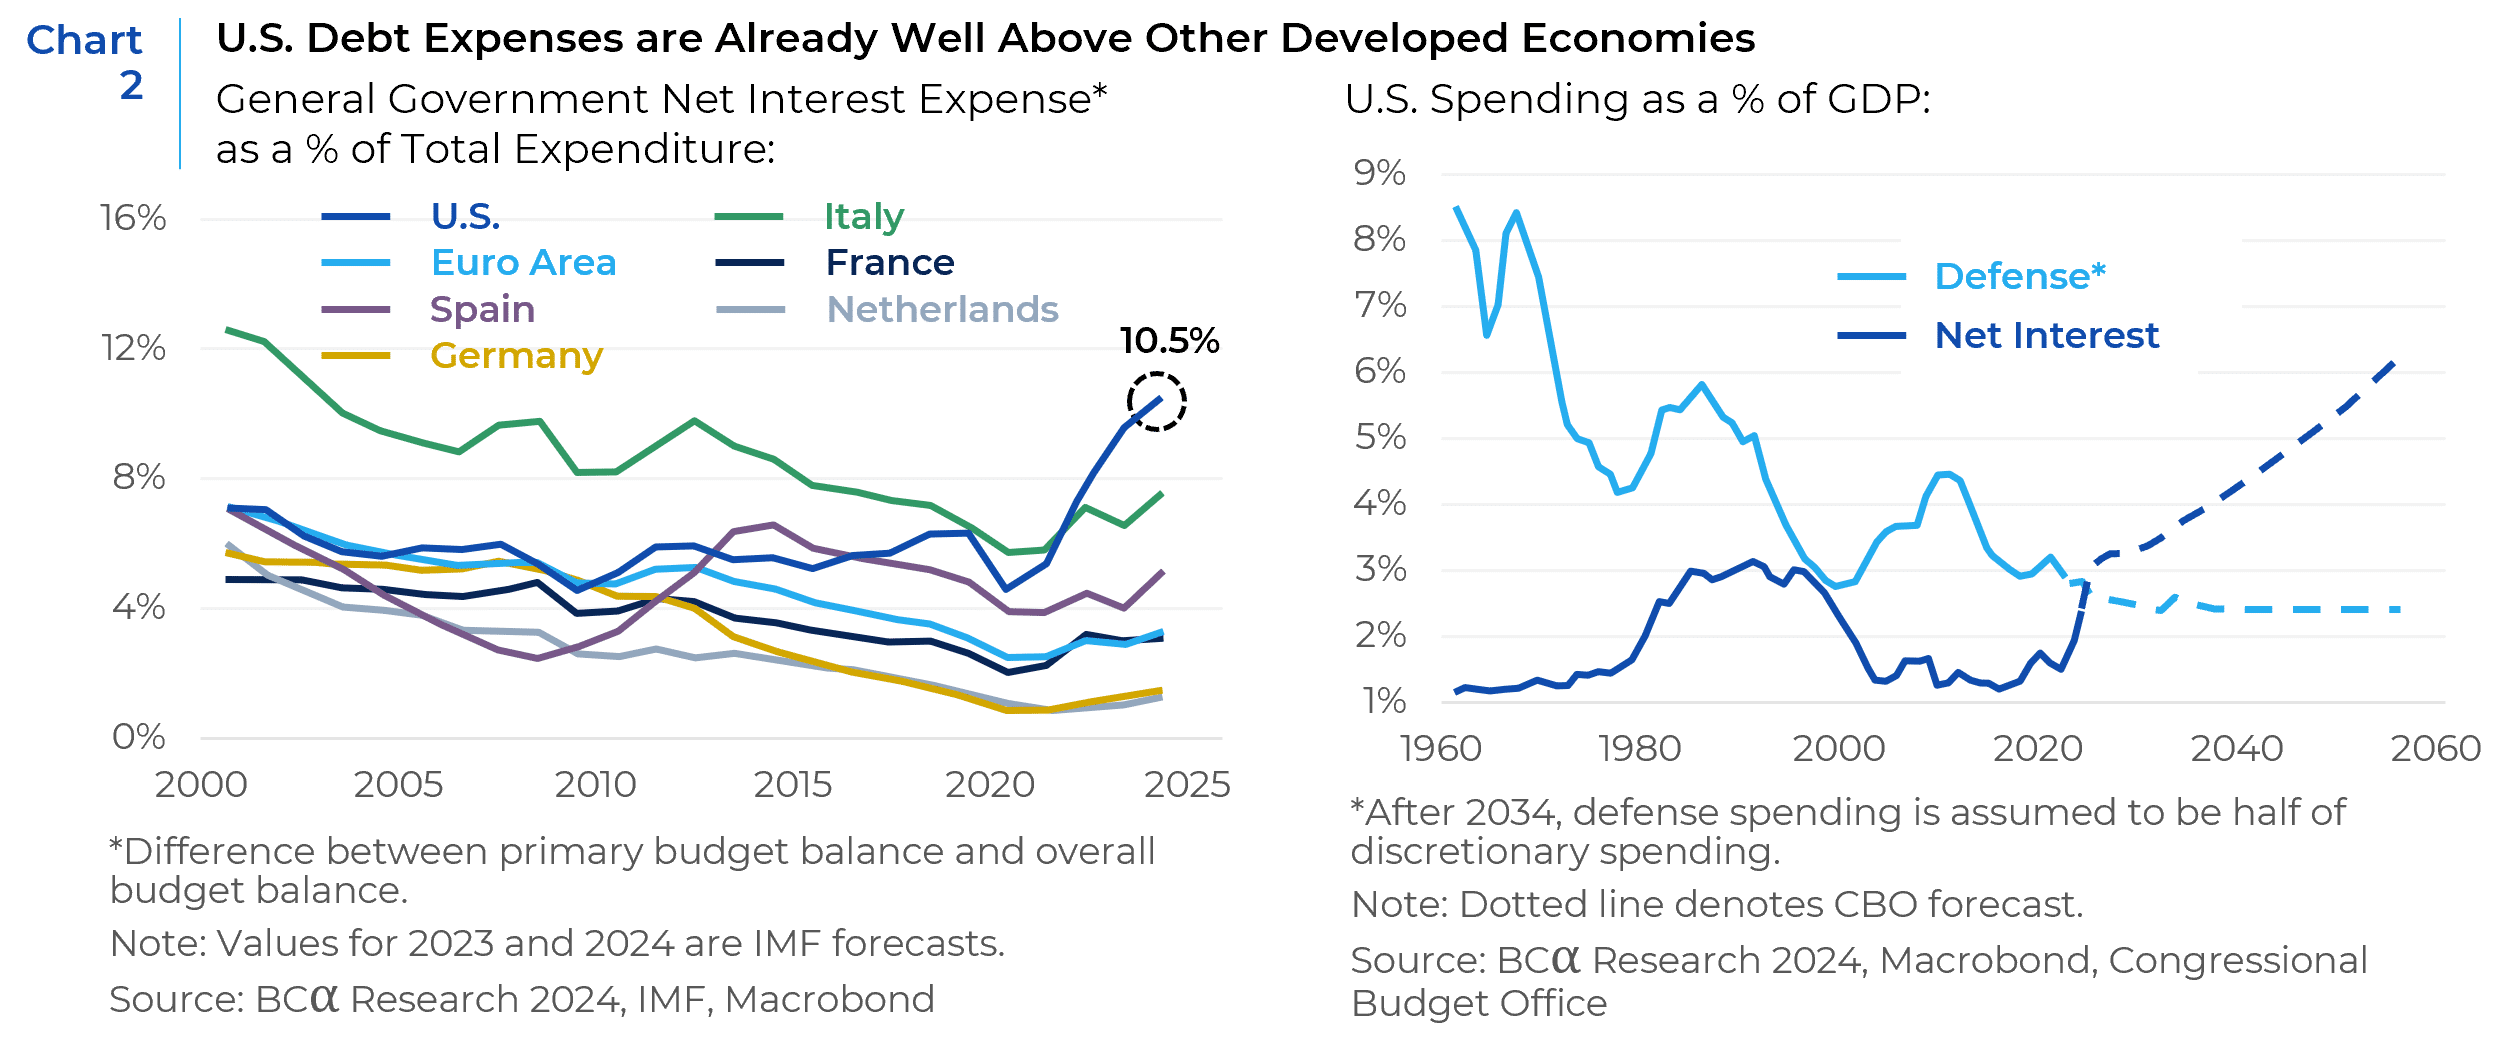
When Trump was first elected in 2016, net interest payments on federal government debt were 1.3% of GDP. By 2024, they were 3.1% of GDP. Current projections on interest payment on the U.S.’s federal debt – which unrealistically assumes the personal tax cuts in the Tax Cuts & Jobs Act (TCJA) or the “Trump tax cuts” of 2017, will be sunset at the end of 2025 – are projected to swell to 4.1% of GDP by 2034. Interest payments would thus absorb 23% of all government revenue, a level which exceeds the defense budget and is well above our European peer nations (see Chart 2).
Most reliable estimates, including those scenarios from the non-profit think tank Committee for a Responsible Federal Budget (CRFB) and the Congressional Budget Office (CBO) show all scenarios of Trump’s policy plans as widening the U.S. deficit further (see Chart 3). The CRFB, which has been a non-partisan watchdog for government spending since the early 1980s, detailed the 10-year costs of various scenarios of Trump’s spending and revenue raising plans (see Table 3). Clearly the most expensive of Trump’s proposals would be the extension of the Tax Cut and Jobs Act (TCJA), which is set to expire at the end of 2025.Trump has said that he intends to not only extend the TCJA but end taxation on Social Security benefits and tips, as well as further lowering the corporate tax rate from 21% to 15% for domestic manufacturers.
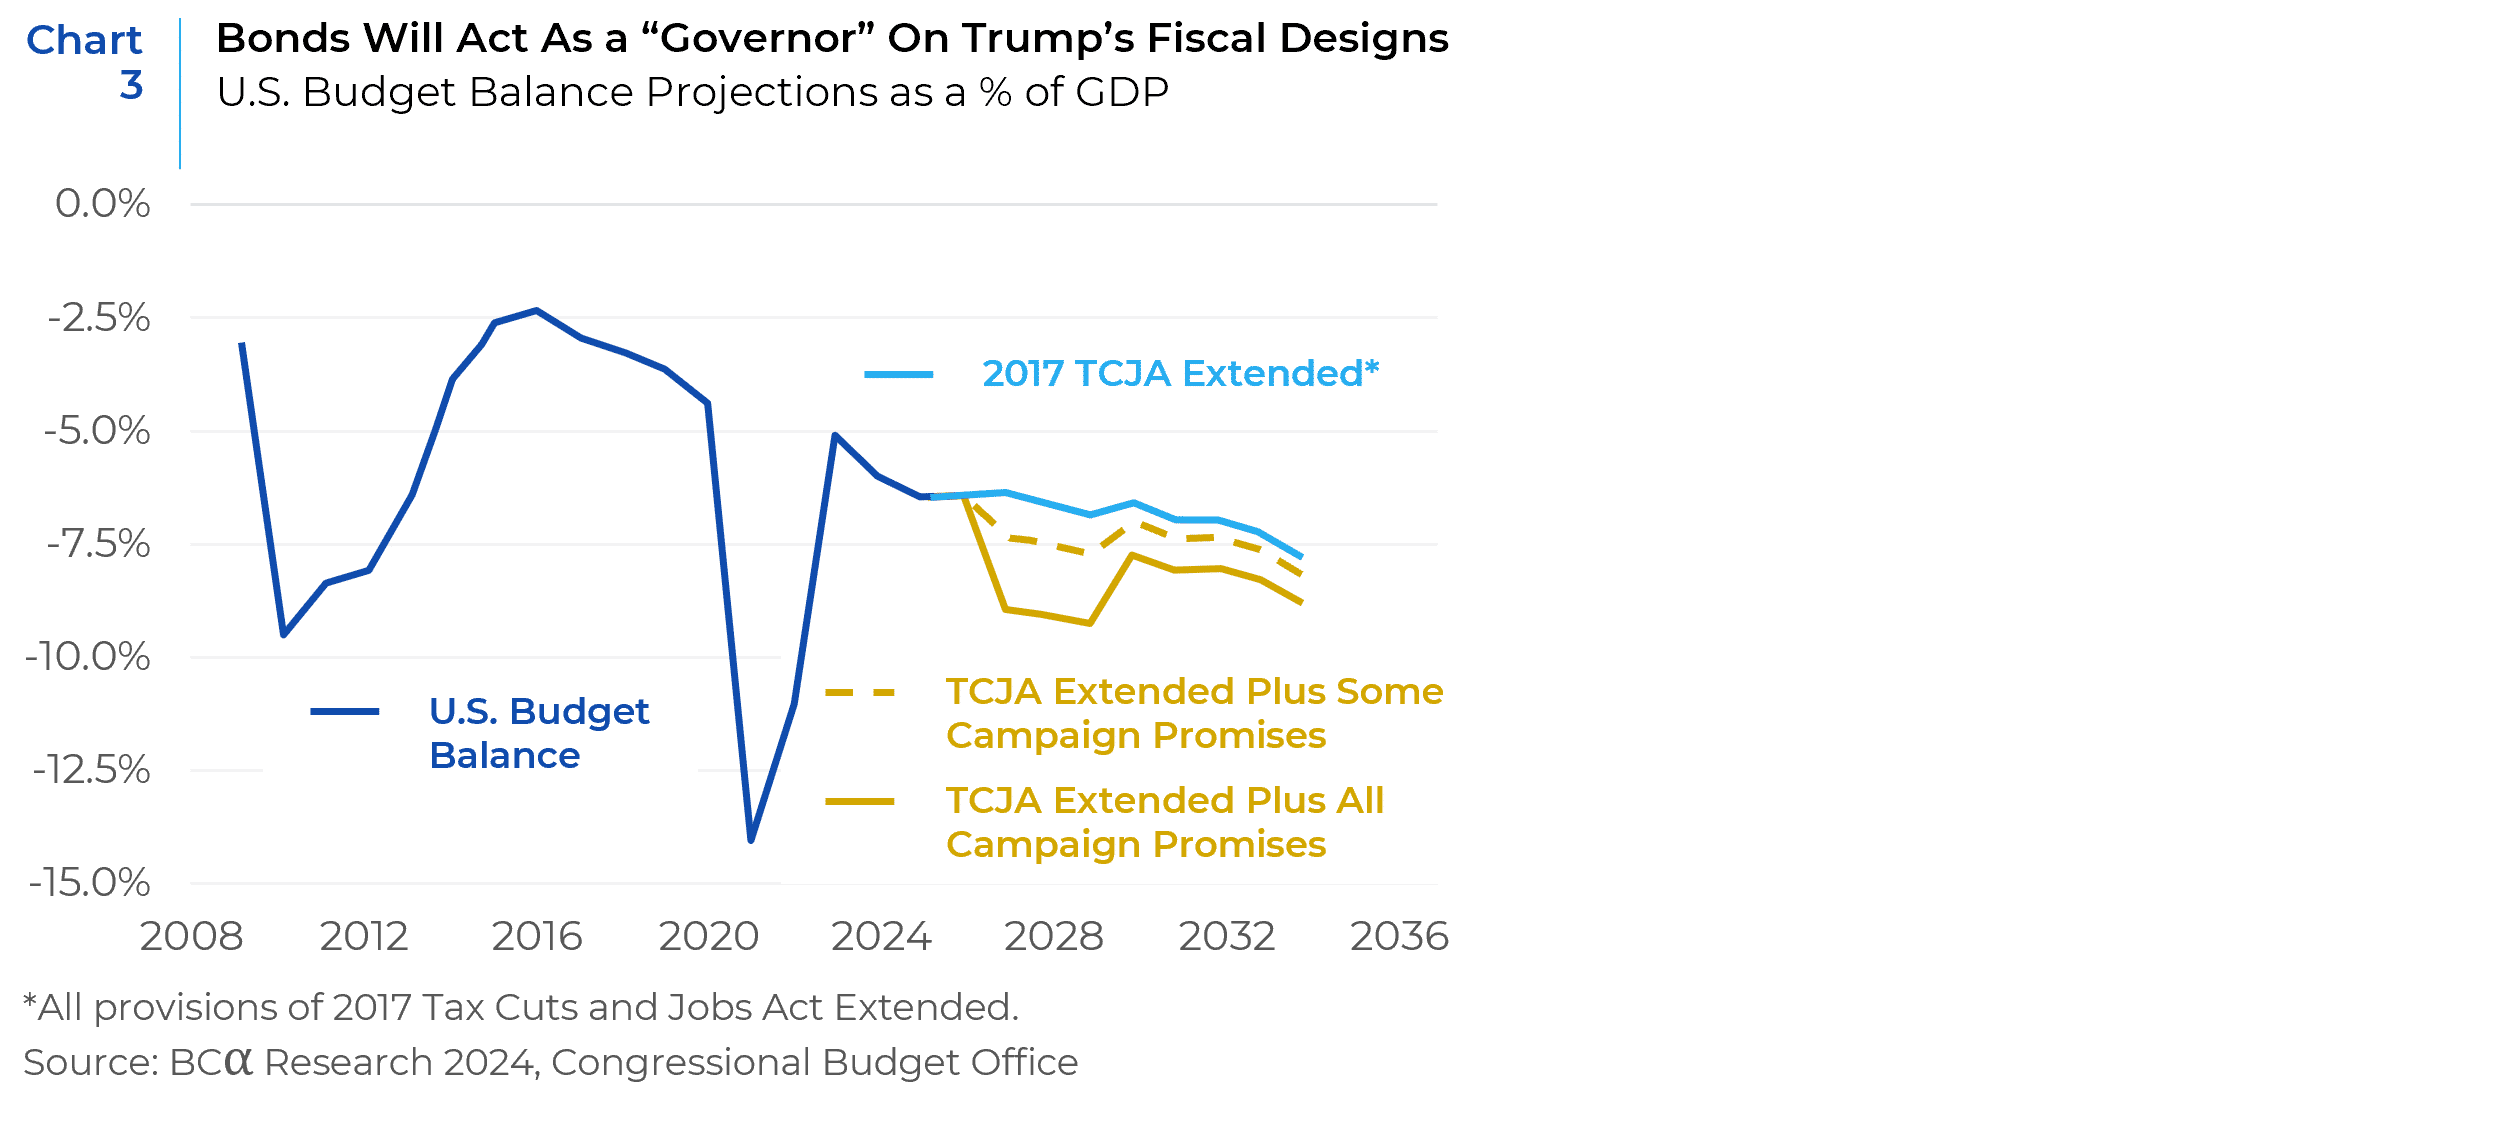
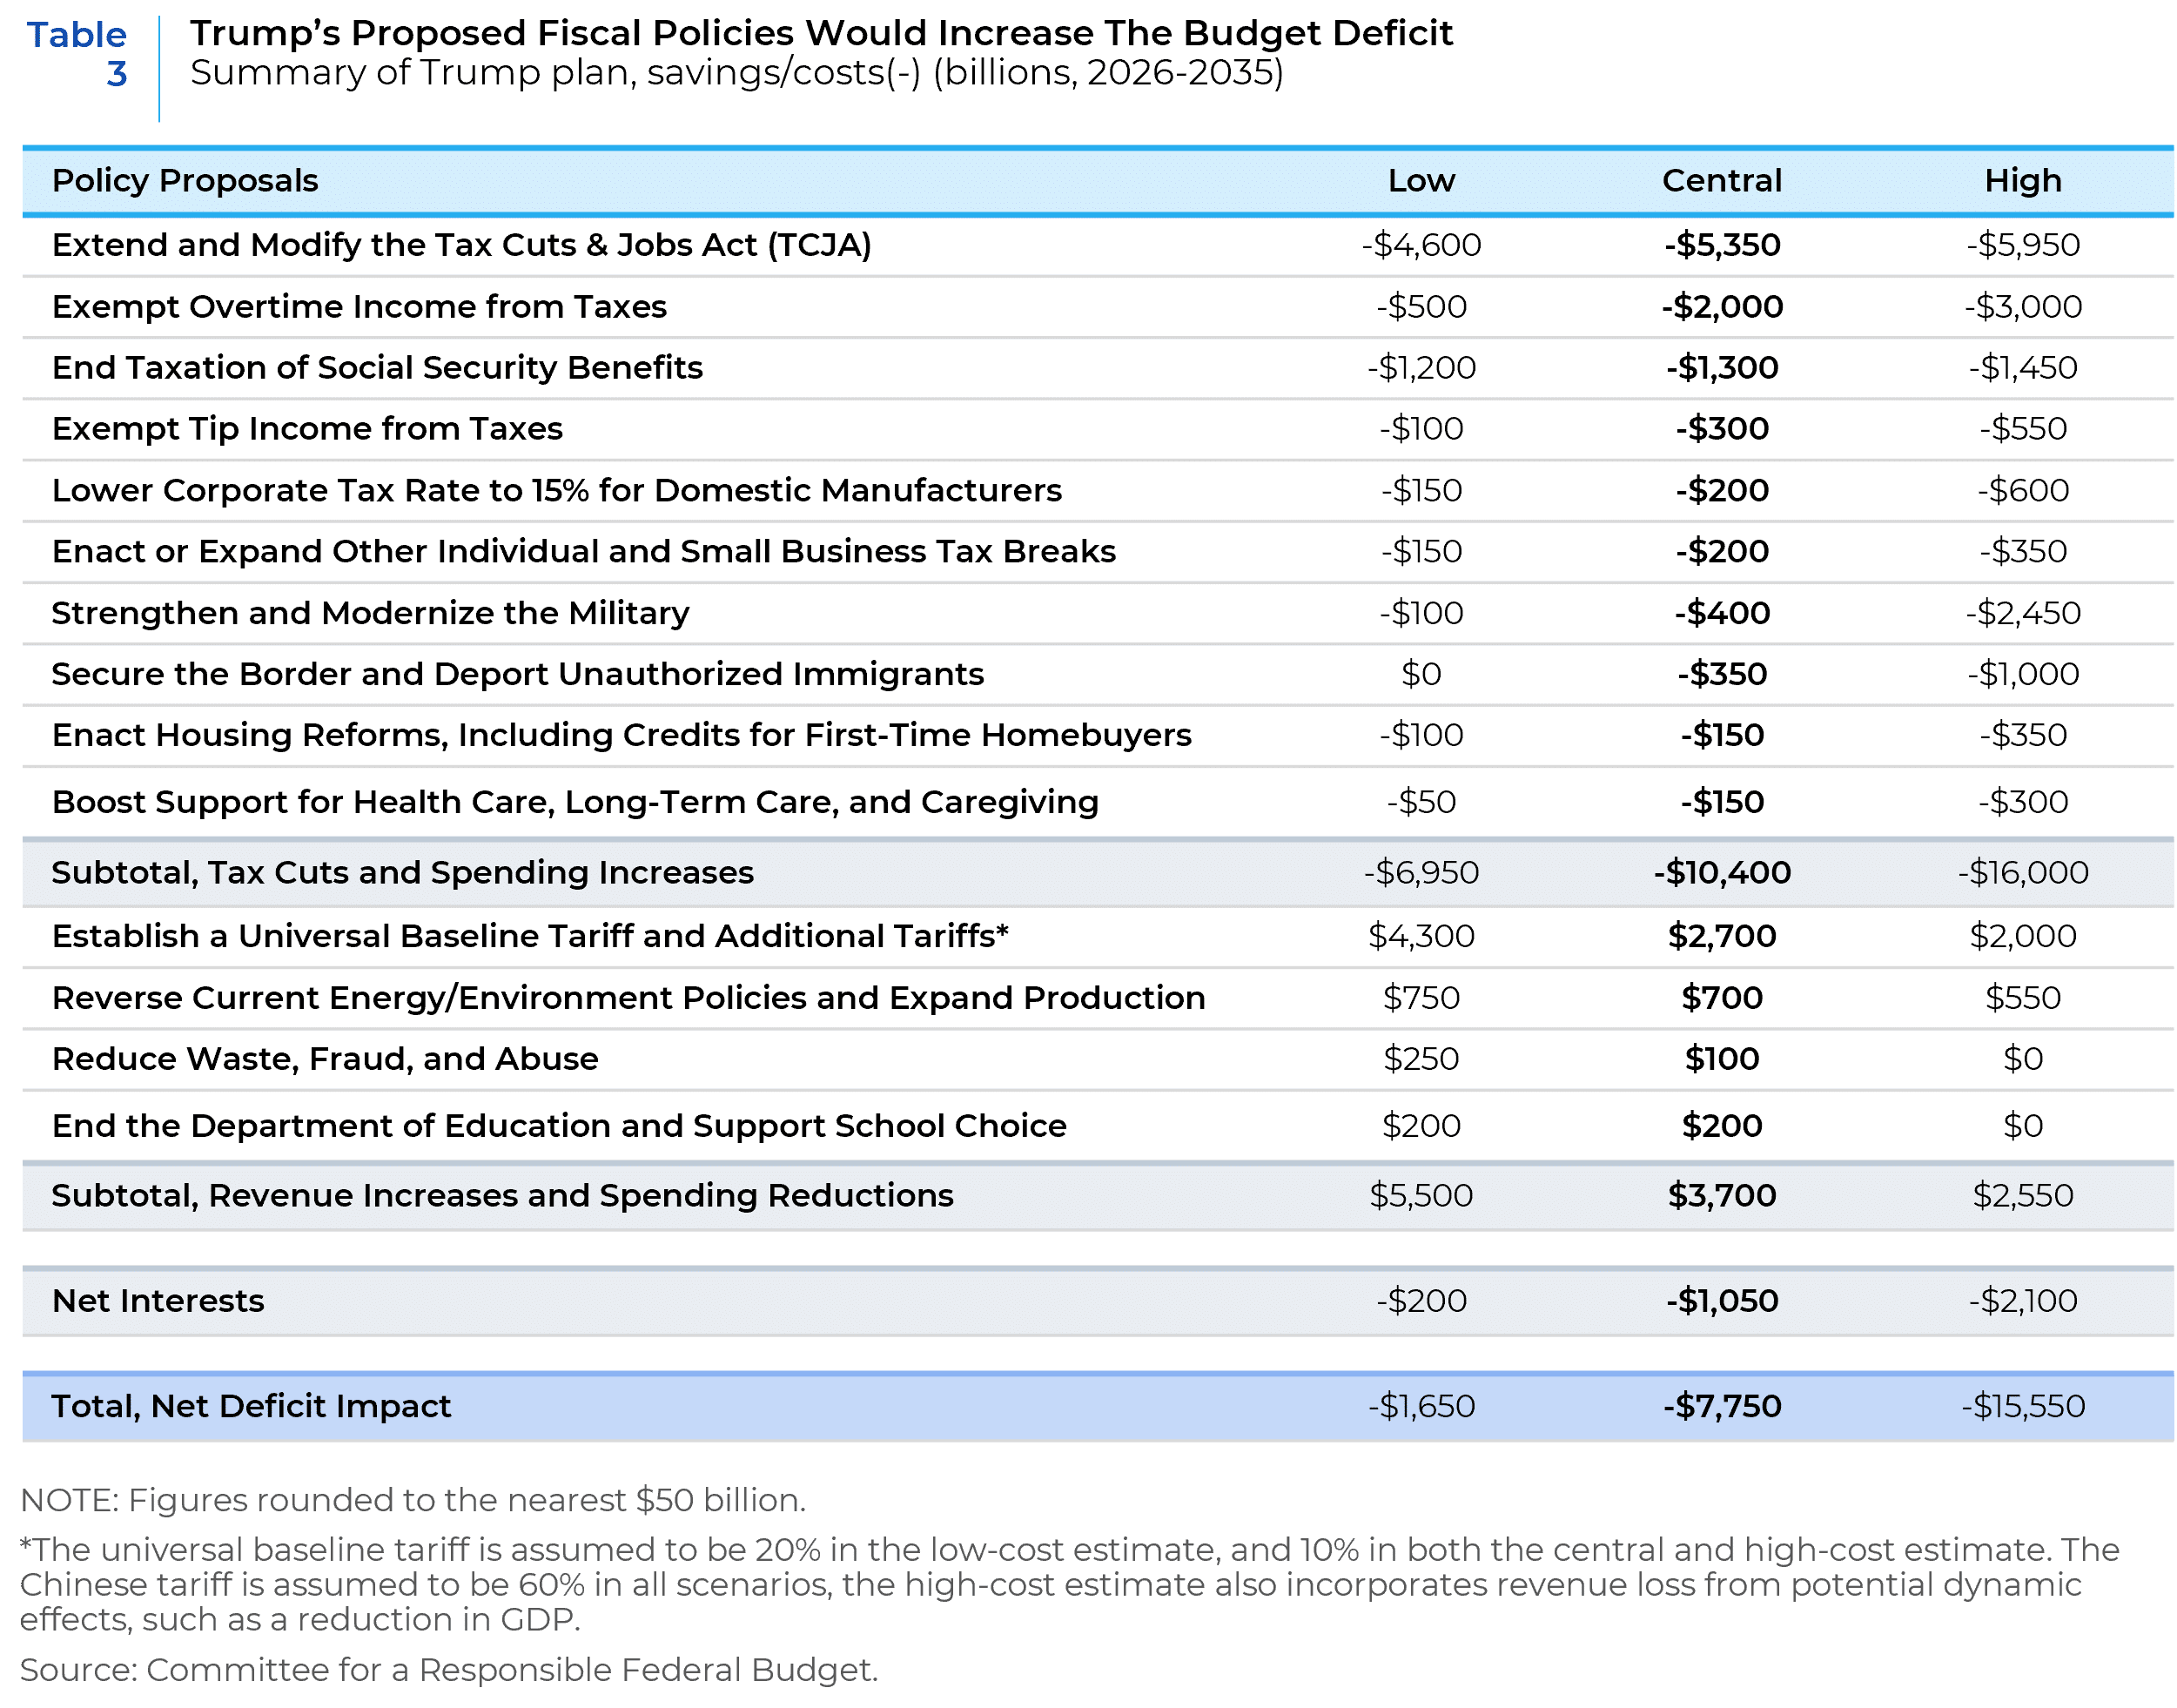
When confronted with the deficit widening impact of his fiscal proposals during the campaign, Trump contended that waste reduction, spending cuts, tariff revenues, and improved economic growth generated from tax cuts and cutting “red tape” would more than compensate for the additional outlays. But as discussed below, each of these claims either face serious constraints or have a decidedly mixed track record. This is again why we believe that the new administration will be hemmed in to policies that are at the low end of the spending range.
Waste Reduction – CRFB estimates on the potential savings from waste reduction put the total potential at about $250 billion at the high end (over 10-years). The largest acknowledged source of government “waste” is Medicare/Medicaid fraud, which the Government Accounting Office and Department of Health and Human Services both estimate at around $100 billion, per year.[1] But even if we (very) generously assume that the Trump Administration and its “DOGE” “committee,” are successful in cutting that waste by half, that still would only offset about 10% of the costs of extending the TCJA alone.
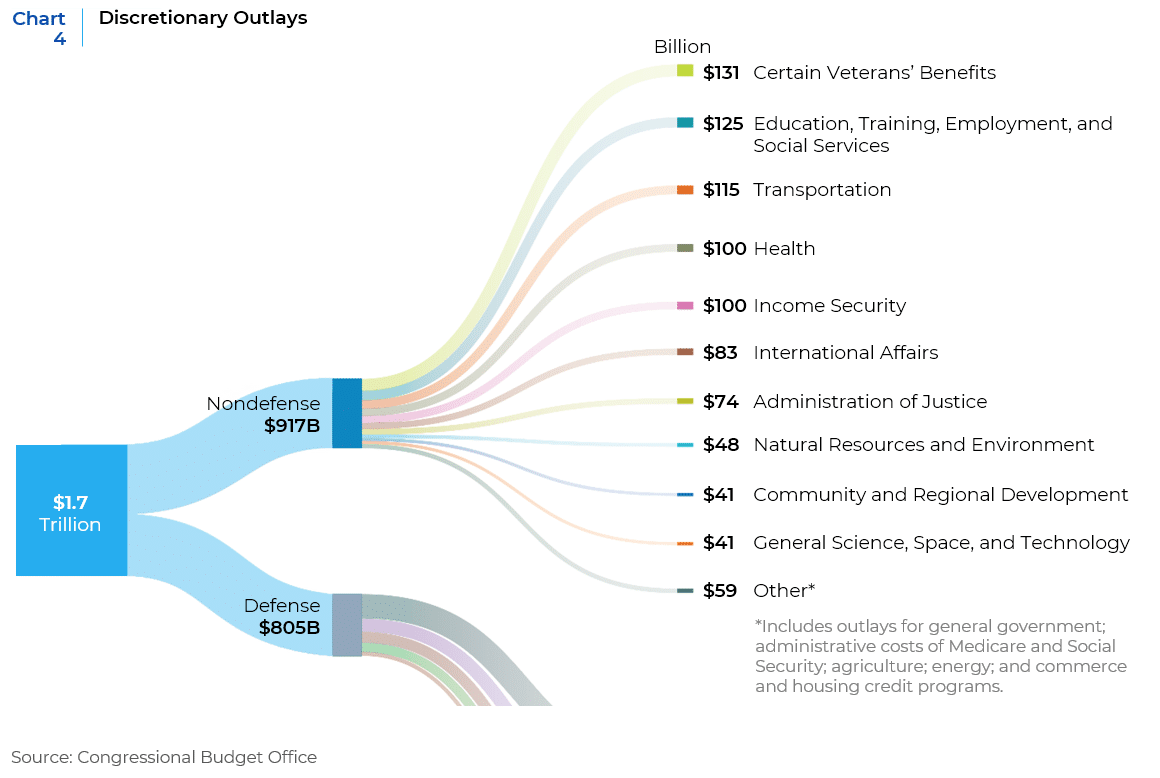
Spending Cuts – Trump has promised to wind down the Department of Education (whose $238 billion budget largely consists of aiding low-income students), and “drain the swamp” of government excess in Washington. The Biden Administration’s Inflation Reduction Act (IRA) is another likely target. Yet government non-defense discretionary spending is only 15% of the entire budget, out of which come many popular and difficult-to-cut expenditures such as veteran’s benefits, the FBI, the FAA, and federal highways (see Chart 4). Given that the TCJA extension alone is estimated to cost roughly $500 Billion per year, finding offsetting spending cuts just for that tax cut would necessitate a roughly 50% cut in all non-defense discretionary spending. Such draconian cuts would be politically challenging in any scenario but especially given the narrow majorities for Republicans in both houses of Congress.
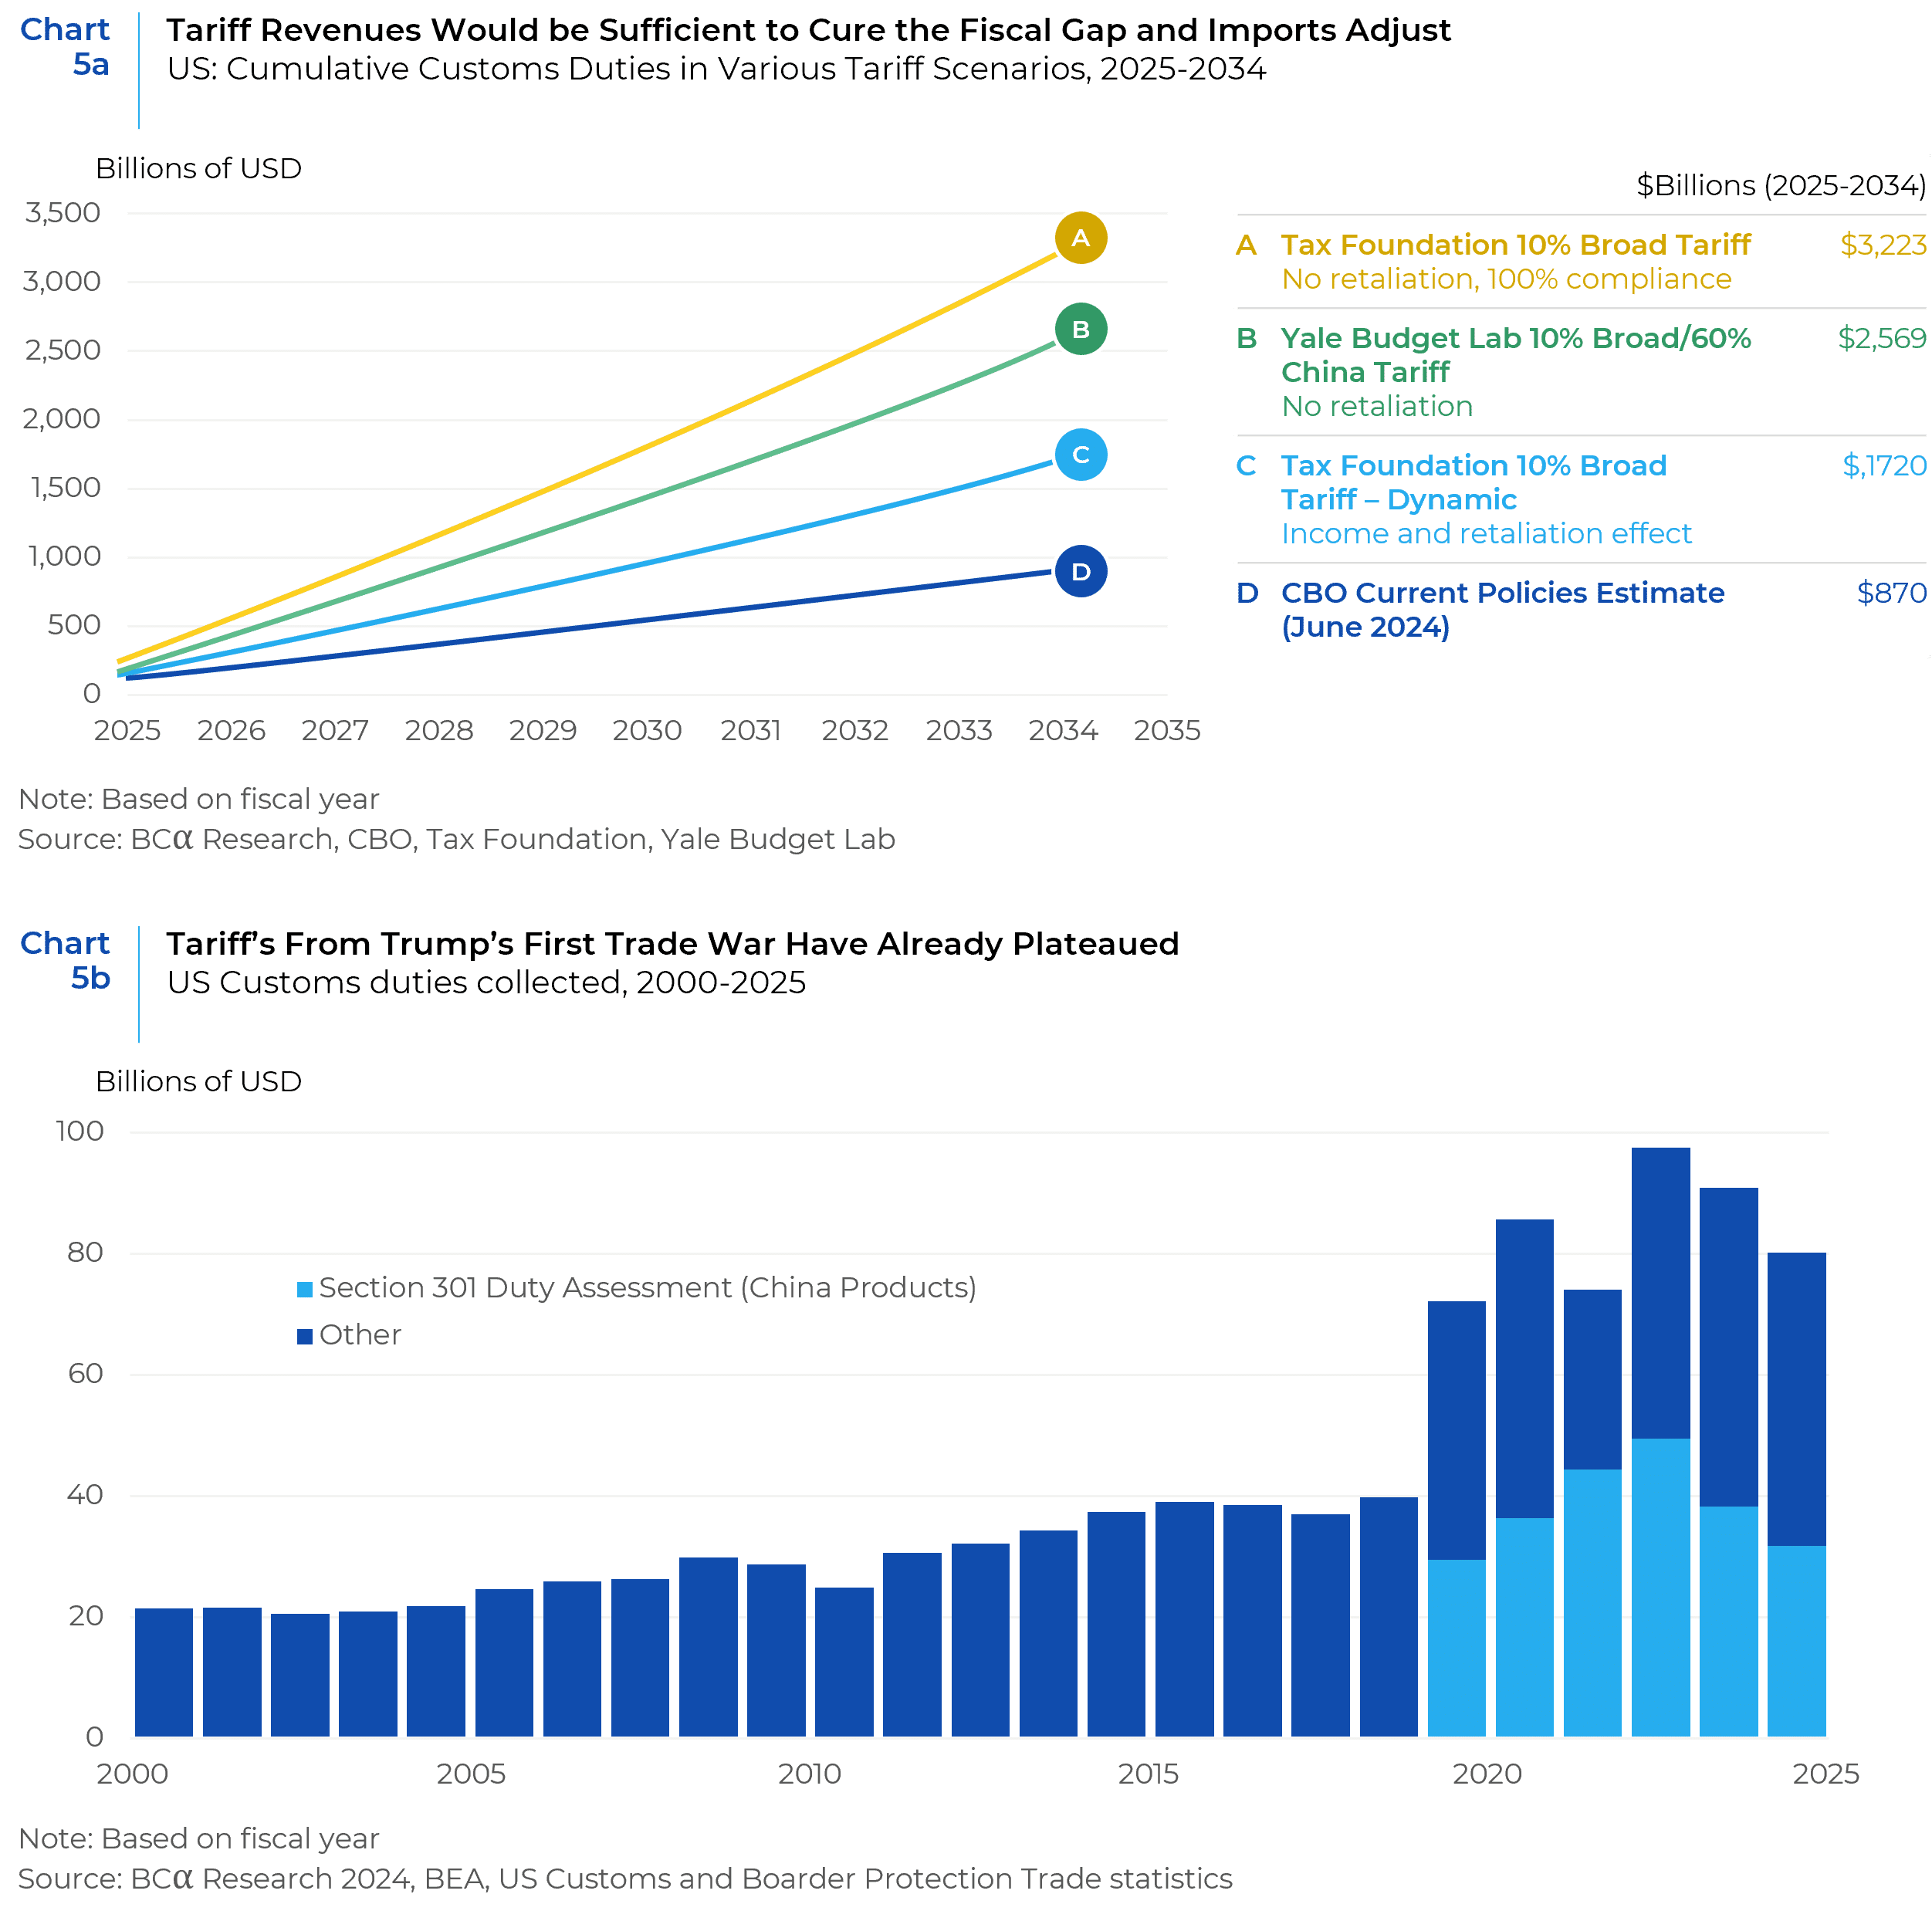
Tariff Revenues – Unlike spending efficiencies, tariffs can, on paper, go a long way to raising substantial revenues, especially given the levels of tariffs that Trump has proposed. But tariffs would only provide meaningful revenue gains if all nations and companies fully complied, and if the added tariffs do not reduce demand for imports. These robust revenue estimates also don’t incorporate retaliation by affected nations or circumvention by shifting supply chains, neither of which is reasonable in today’s globalized market. But one needn’t speculate too much to see the marginal returns from tariffs. Additional tariff revenues from Trump’s first trade war have already plateaued at a mere $40 billion per year (see Charts 5a and 5b), less than 10% of the projected costs of extending the TCJA.
Additional Tax Revenue, Due to Higher Growth from Tax Cuts
Trump has also asserted that extending the TCJA would boost growth and thus tax receipts. Without question, the years following the 2017 TCJA were good ones for the American economy in that unemployment was low and income growth was high. But correlation is not causation; and positive economic performance does not prima facie prove that supply-side tax cuts have succeeded. The post TCJA period, for example, also coincided with extraordinarily stimulative monetary policy (which resulted in low interest rates) and fiscal policy which boosted aggregate demand and consumption (as well the budget deficit) at the peak of the business cycle.
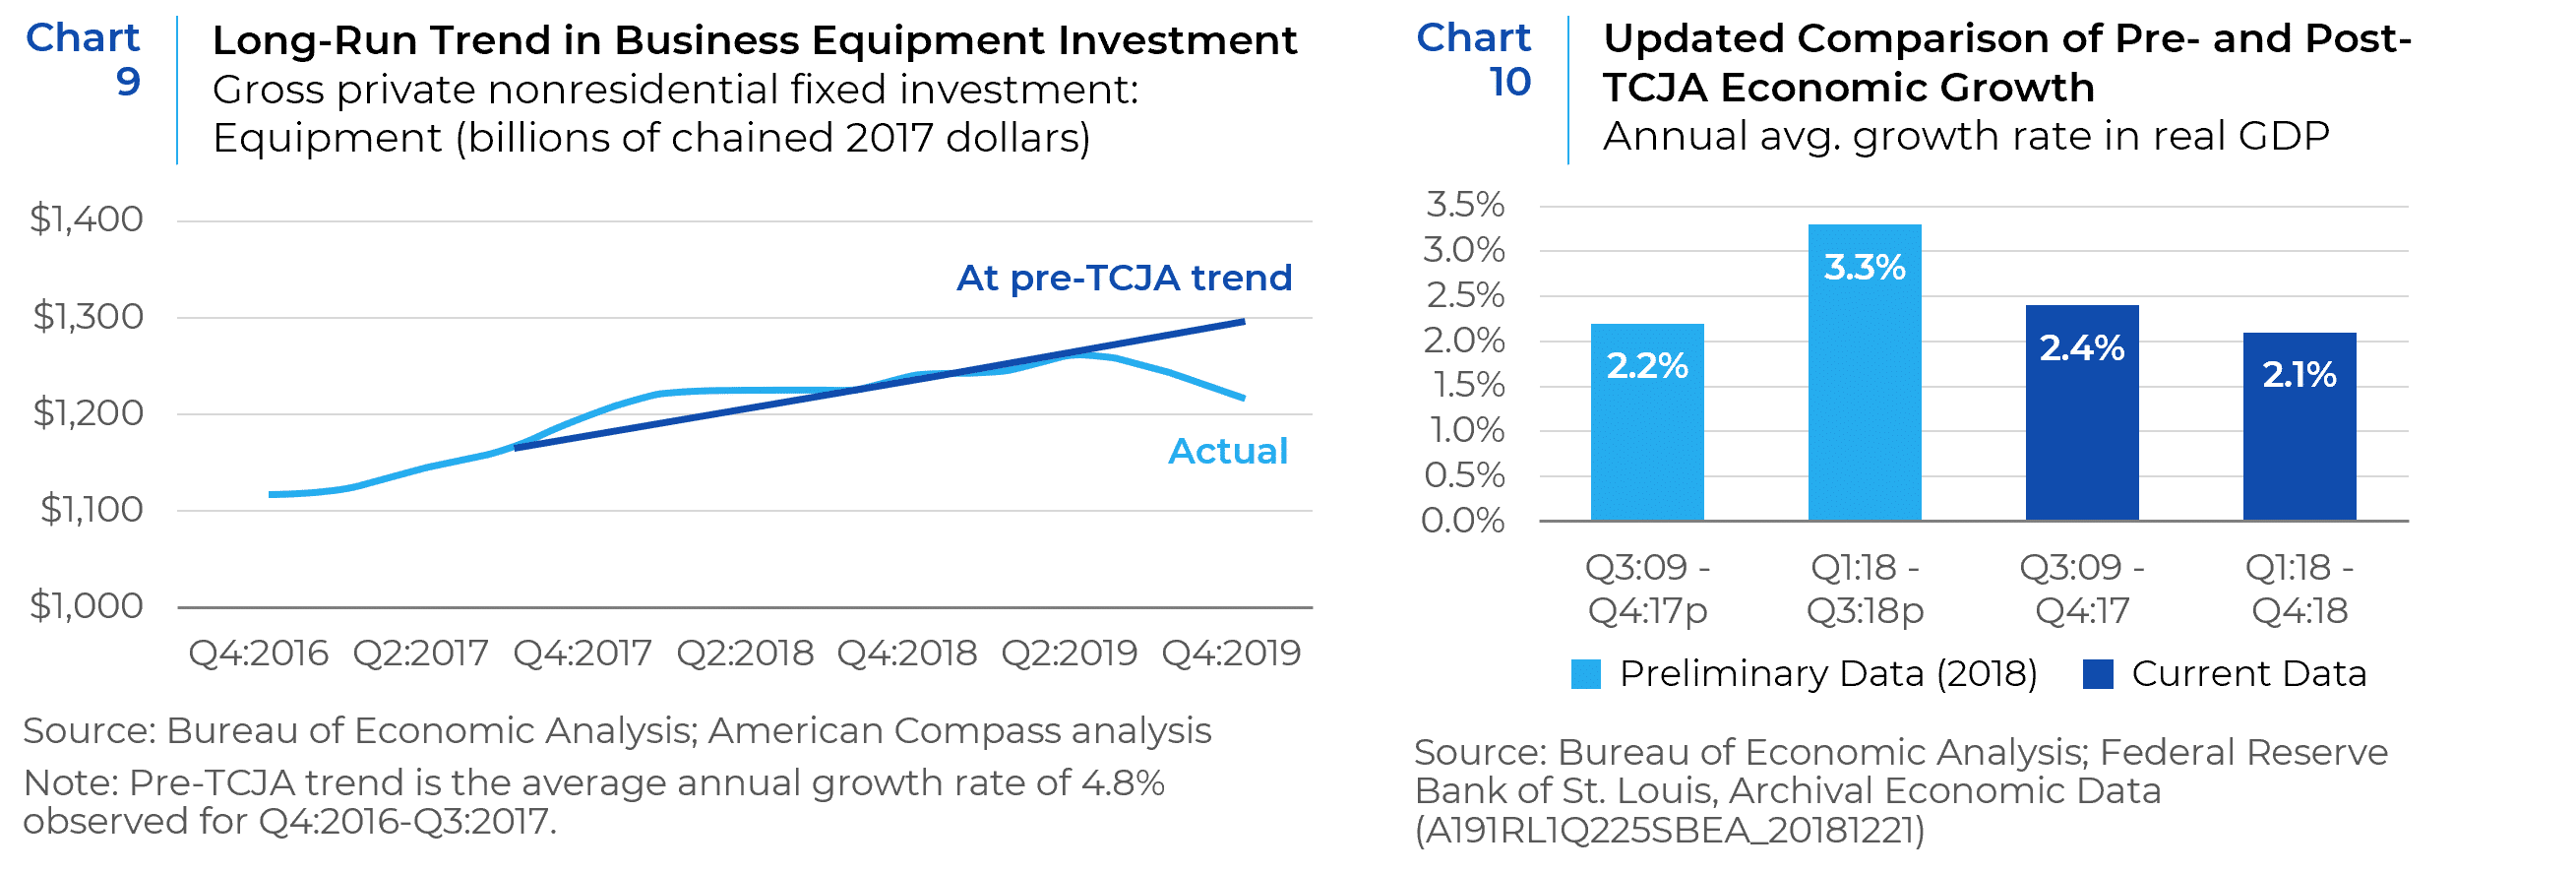
Supply-side tax cuts such as the Bush tax cuts of 2001 and 2003 and the TCJA are supposed to boost revenue-enhancing economic growth by improving incentives that in turn spur business investment. However, neither business investment nor GDP increased after the George W. Bush era tax cuts (see Charts 6 and 7). The pre-pandemic period that followed the TCJA also showed no sustained improvement in either GDP or business investment following its implementation in 2017-2018 (see Charts 8, 9, and 10). Additionally, any analysis of the TCJA’s effects must separate the short-run effect of pulling forward investment from the long-run effect of raising the overall level of capital investment. For example, an analysis by American Compass showed that allowing corporations to expense the full cost of any investments made in Q4:2017 led to a 12.9% annualized growth that quarter, followed by a 7.3% growth rate in the first quarter of 2018. But what followed were two quarters of 0.7% and 0.0% growth. All told, the average growth rate in equipment investment for TCJA’s first four quarters (5.2%) was little different from the prior four quarters (4.8%). In TCJA’s second year, average growth in equipment investment fell to 1.7%. Had growth continued post-TCJA at the same rate as in the four quarters pre-TCJA, equipment investment at the end of 2019 would have stood at $1.30 trillion (annualized). With TCJA, it reached only $1.22 trillion.
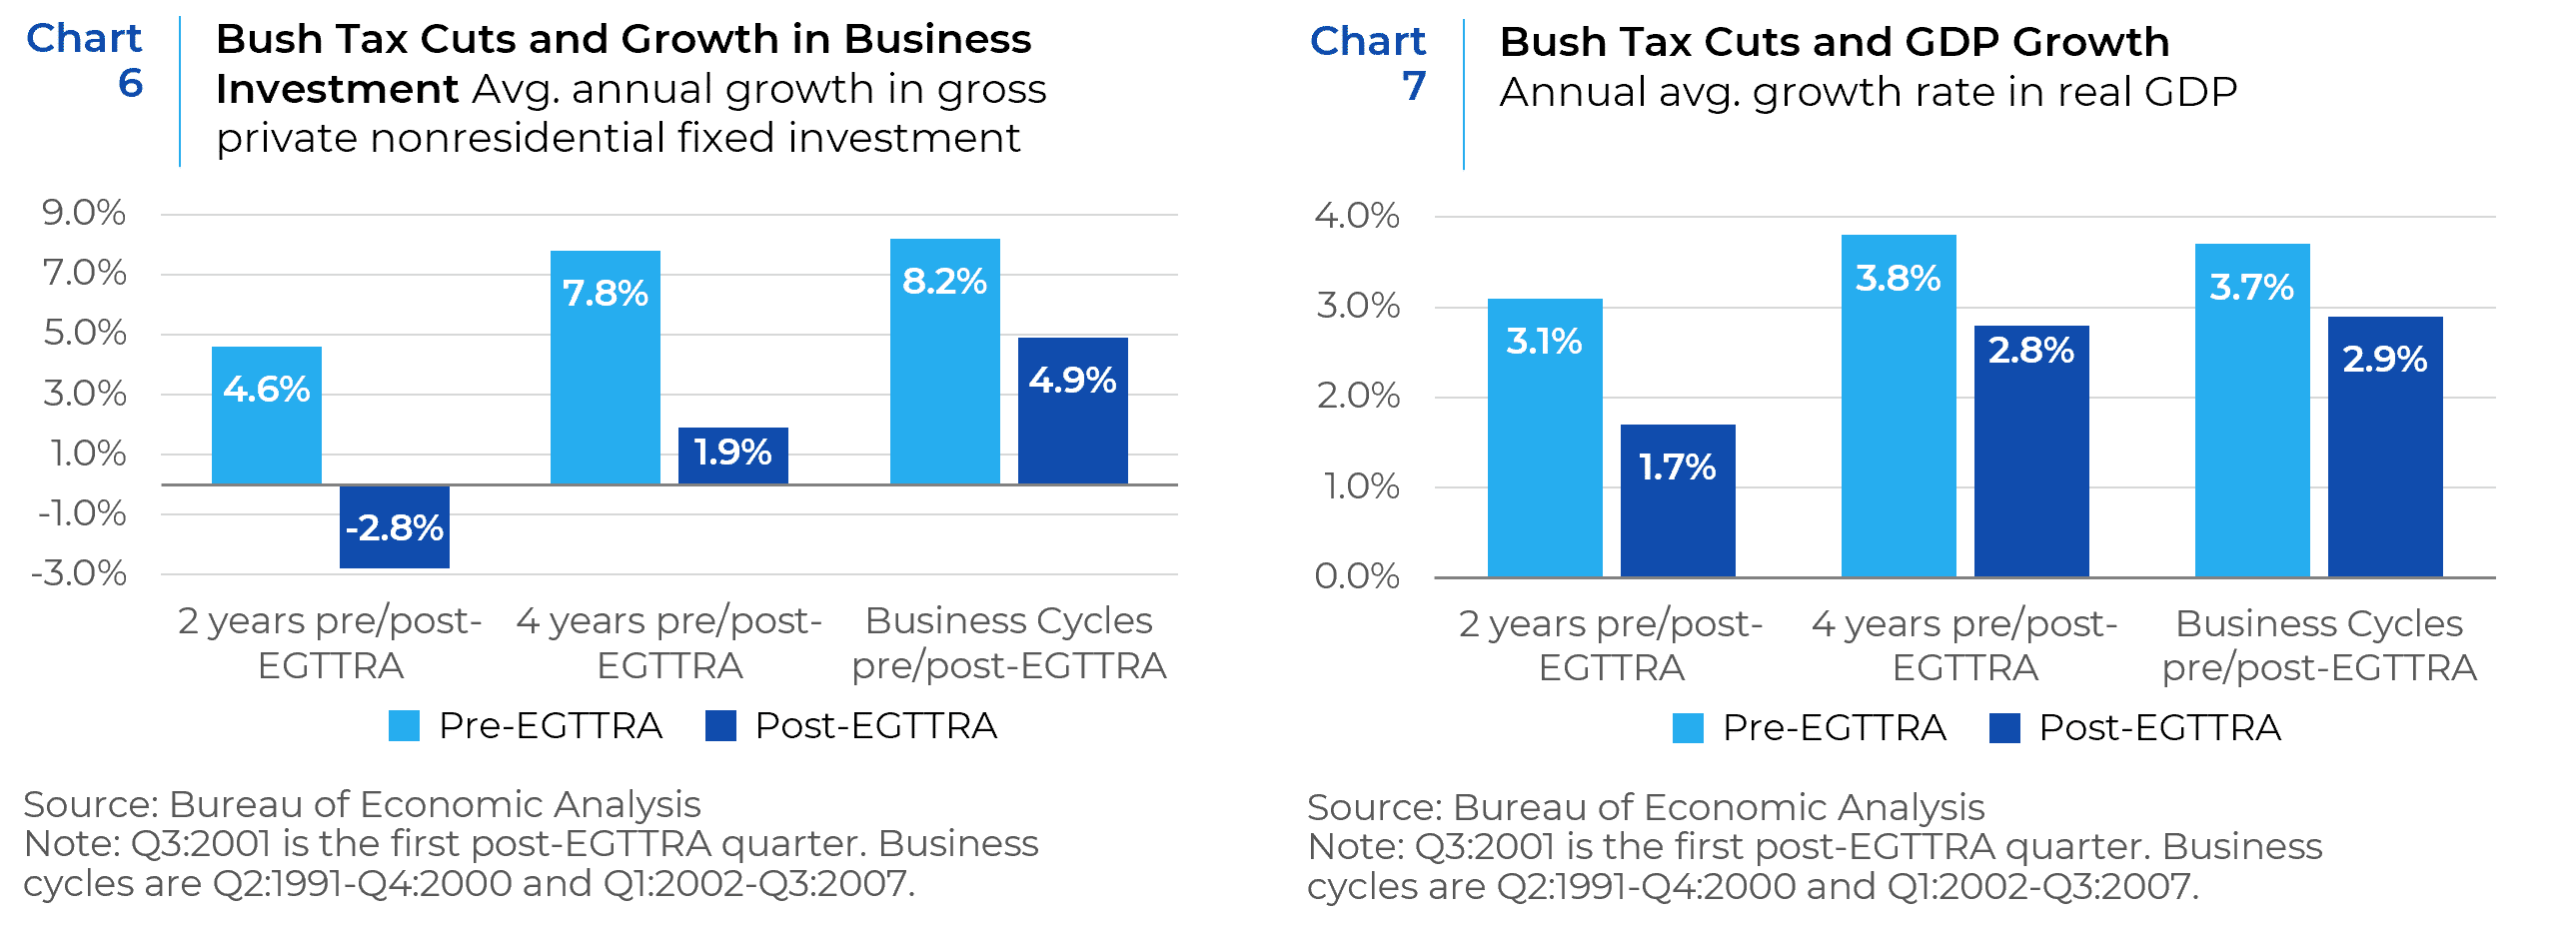

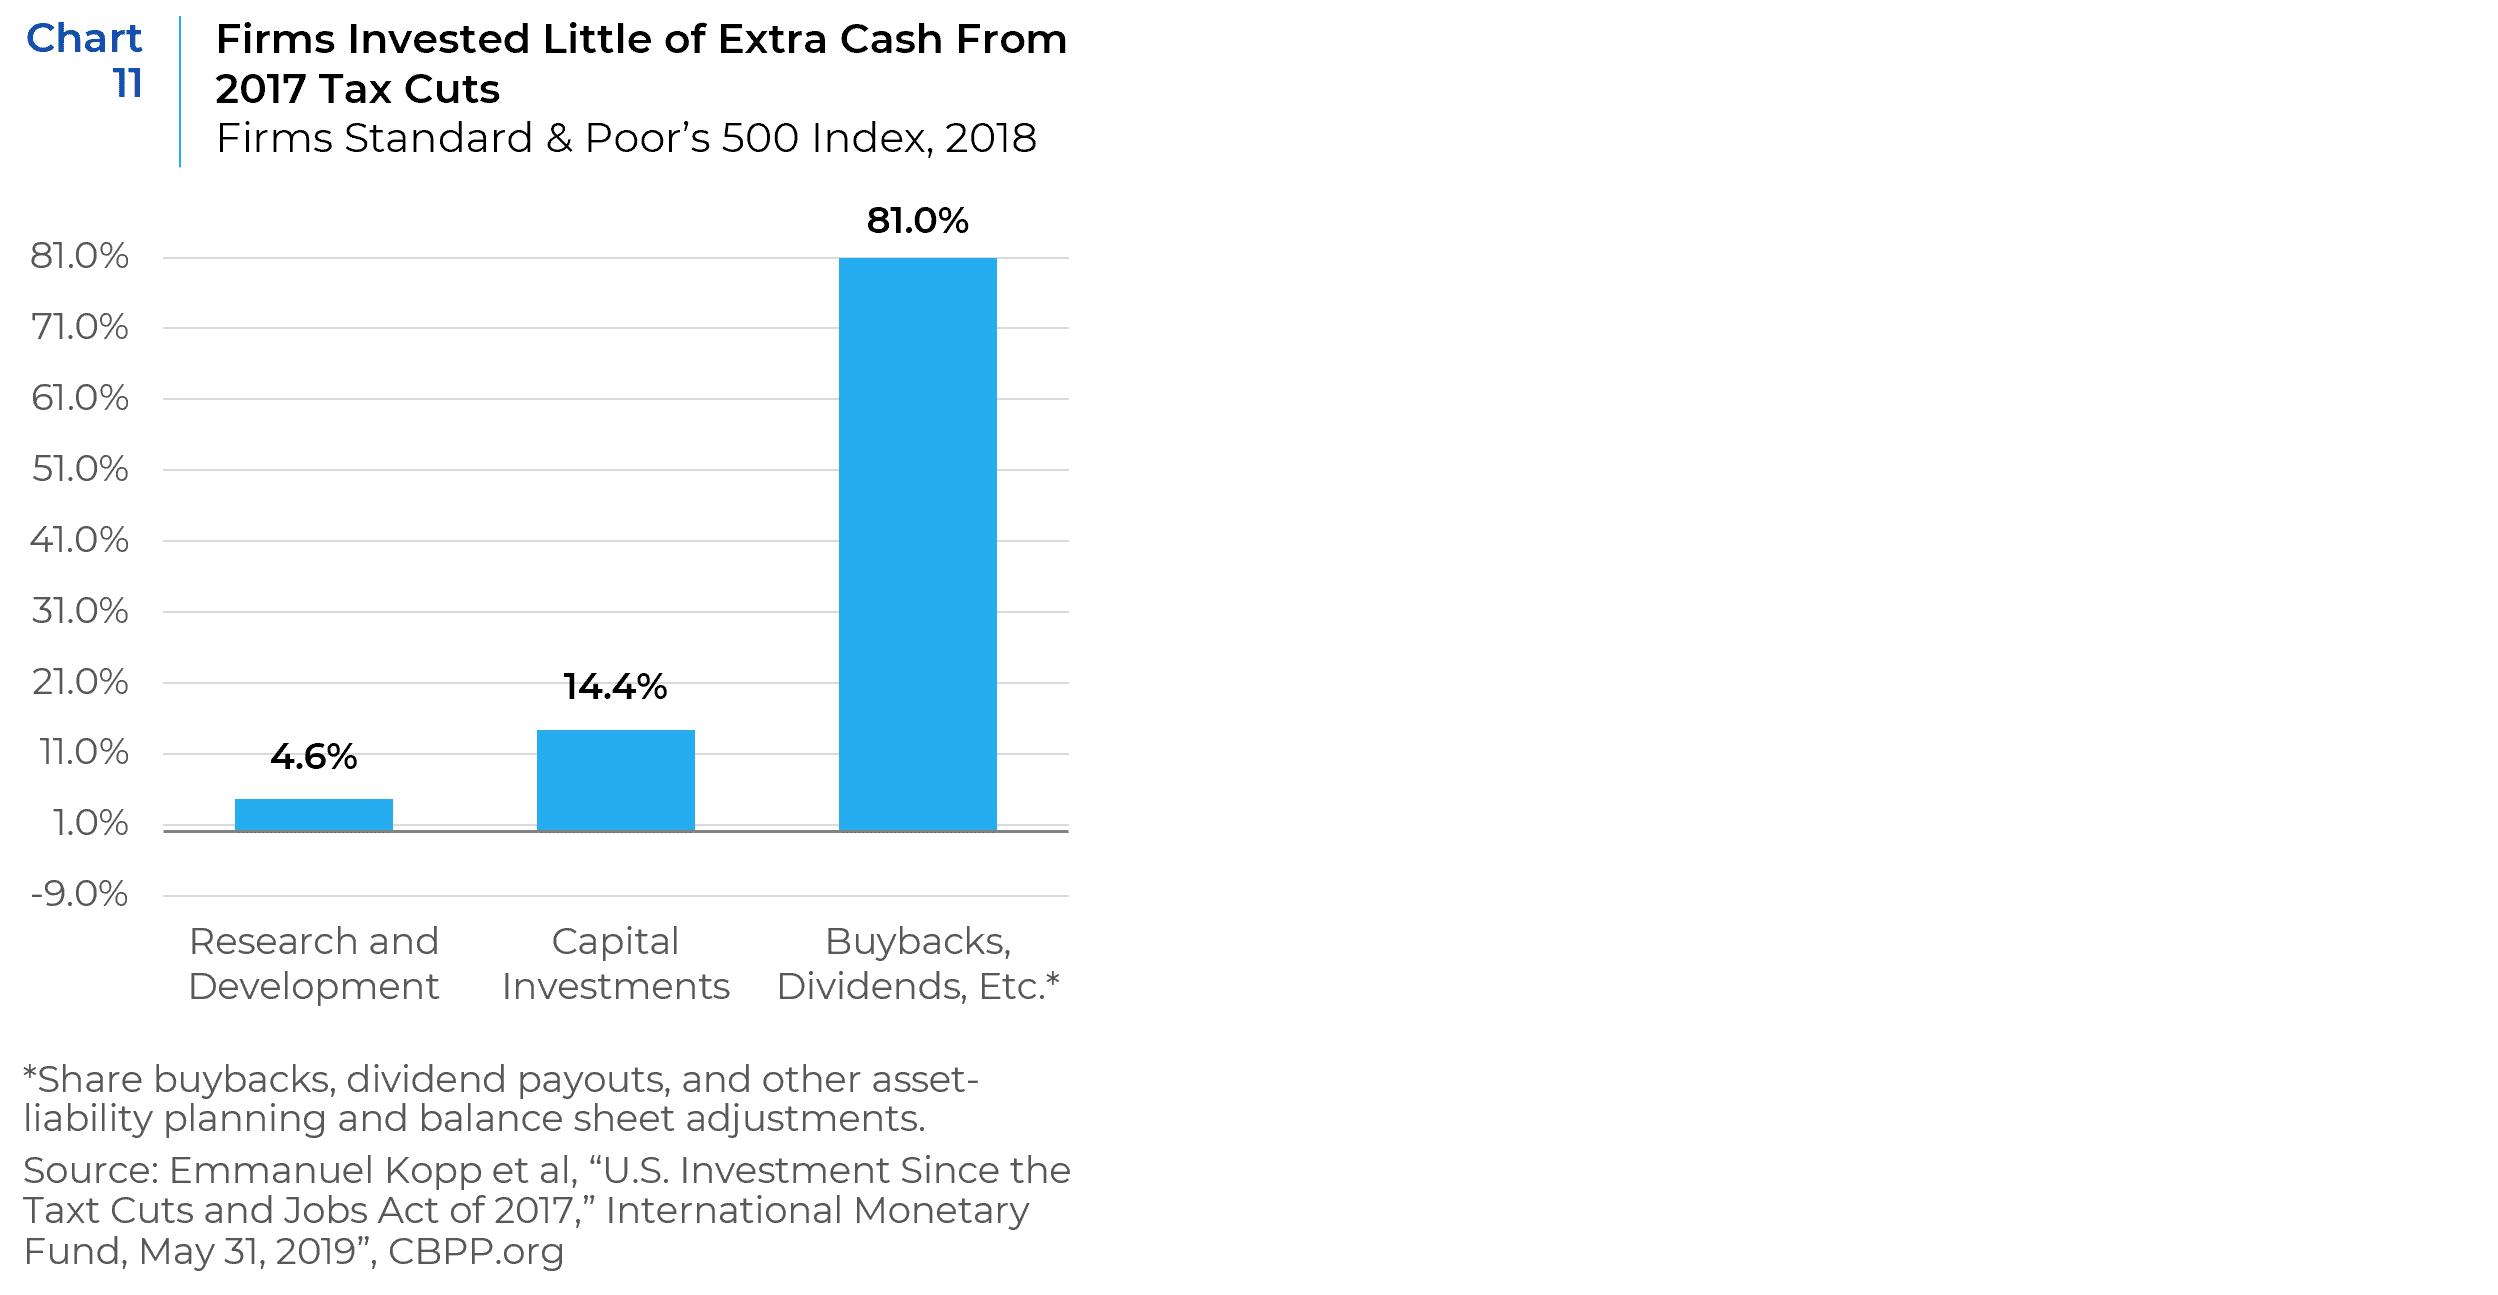
There are many reasons why business investments did not increase after the Bush and Trump tax cuts. For one, America’s contemporary economic disease is different from the one that President Reagan addressed in the 1980s. The top marginal federal income tax rate is almost half the 70% rate that Reagan inherited. High-income households that pay most of the income tax roll, and thus along with corporations, disproportionately benefitted from both the Bush and Trump tax cuts, also have a low propensity to spend any windfall. For corporations, standard economic models suggest that firms will invest projects where the risk-adjusted return exceeds their cost of capital. Cutting the corporate tax rate effectively lowers the cost of capital or increases the expected return and should therefore cause more projects to go forward. But empirical data has shown that rather than investing in R&D or additional projects, many corporations have instead returned cash to shareholders through dividends and buybacks. Accordingly, as with the Bush Tax cuts, a study by the IMF found that most of the additional earnings from the TCJA went into share buybacks. Those buybacks boosted corporate earnings and turbocharged stock prices in the financial economy, but comparatively negligible expenditures on R&D or capital investment led to an equally negligible sustained boost to the real economy (see Chart 11).
As the Wall Street Journal’s Chief Economics commentator Greg Ip observed at the end of 2019:
“The U.S. economy did enjoy a burst of 3% annualized growth after the tax cut first took effect at the start of 2018. But it has since slipped. It grew at a 1.9% annual rate in the third quarter. In the past 12 months, the economy grew 2%, about the same as it averaged from 2011 through 2017. This should not come as a surprise. The administration’s claims rested on the belief that cutting the corporate tax rate to 21% from 35% and allowing companies to immediately write off the cost of new equipment would boost business investment and thus worker productivity and wages. Yet numerous other advanced countries had already cut their corporate rates in the prior two decades without experiencing anywhere near the growth boost the Trump administration promised. Many experienced no boost at all.”
Congress and the Bond Market Are Likely to Resist Runaway Deficit Spending
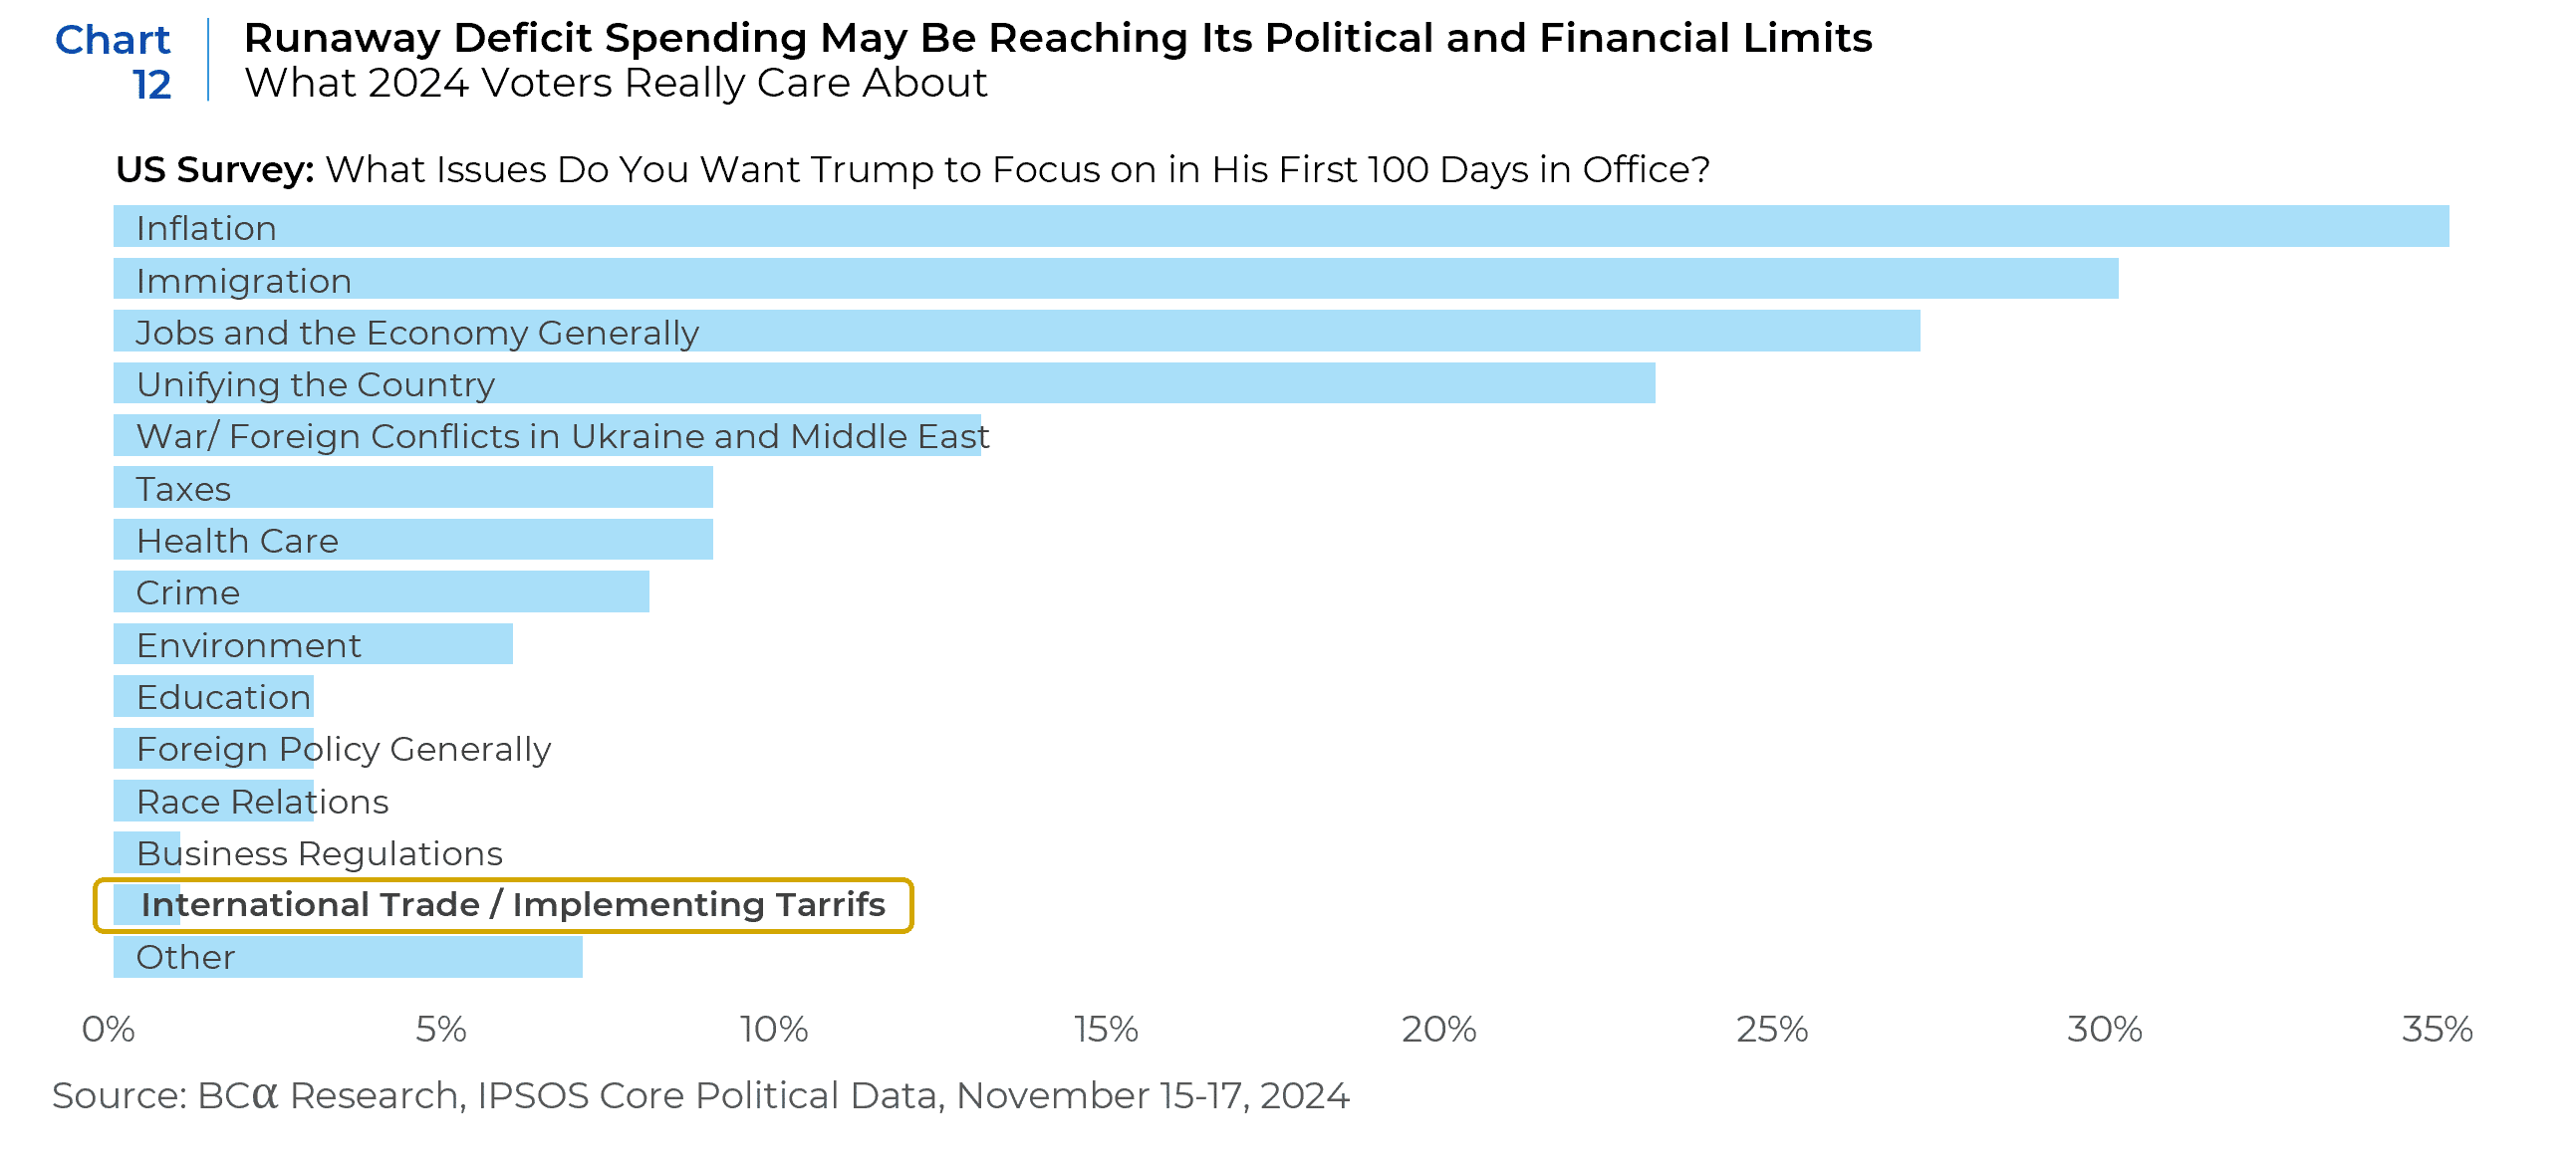
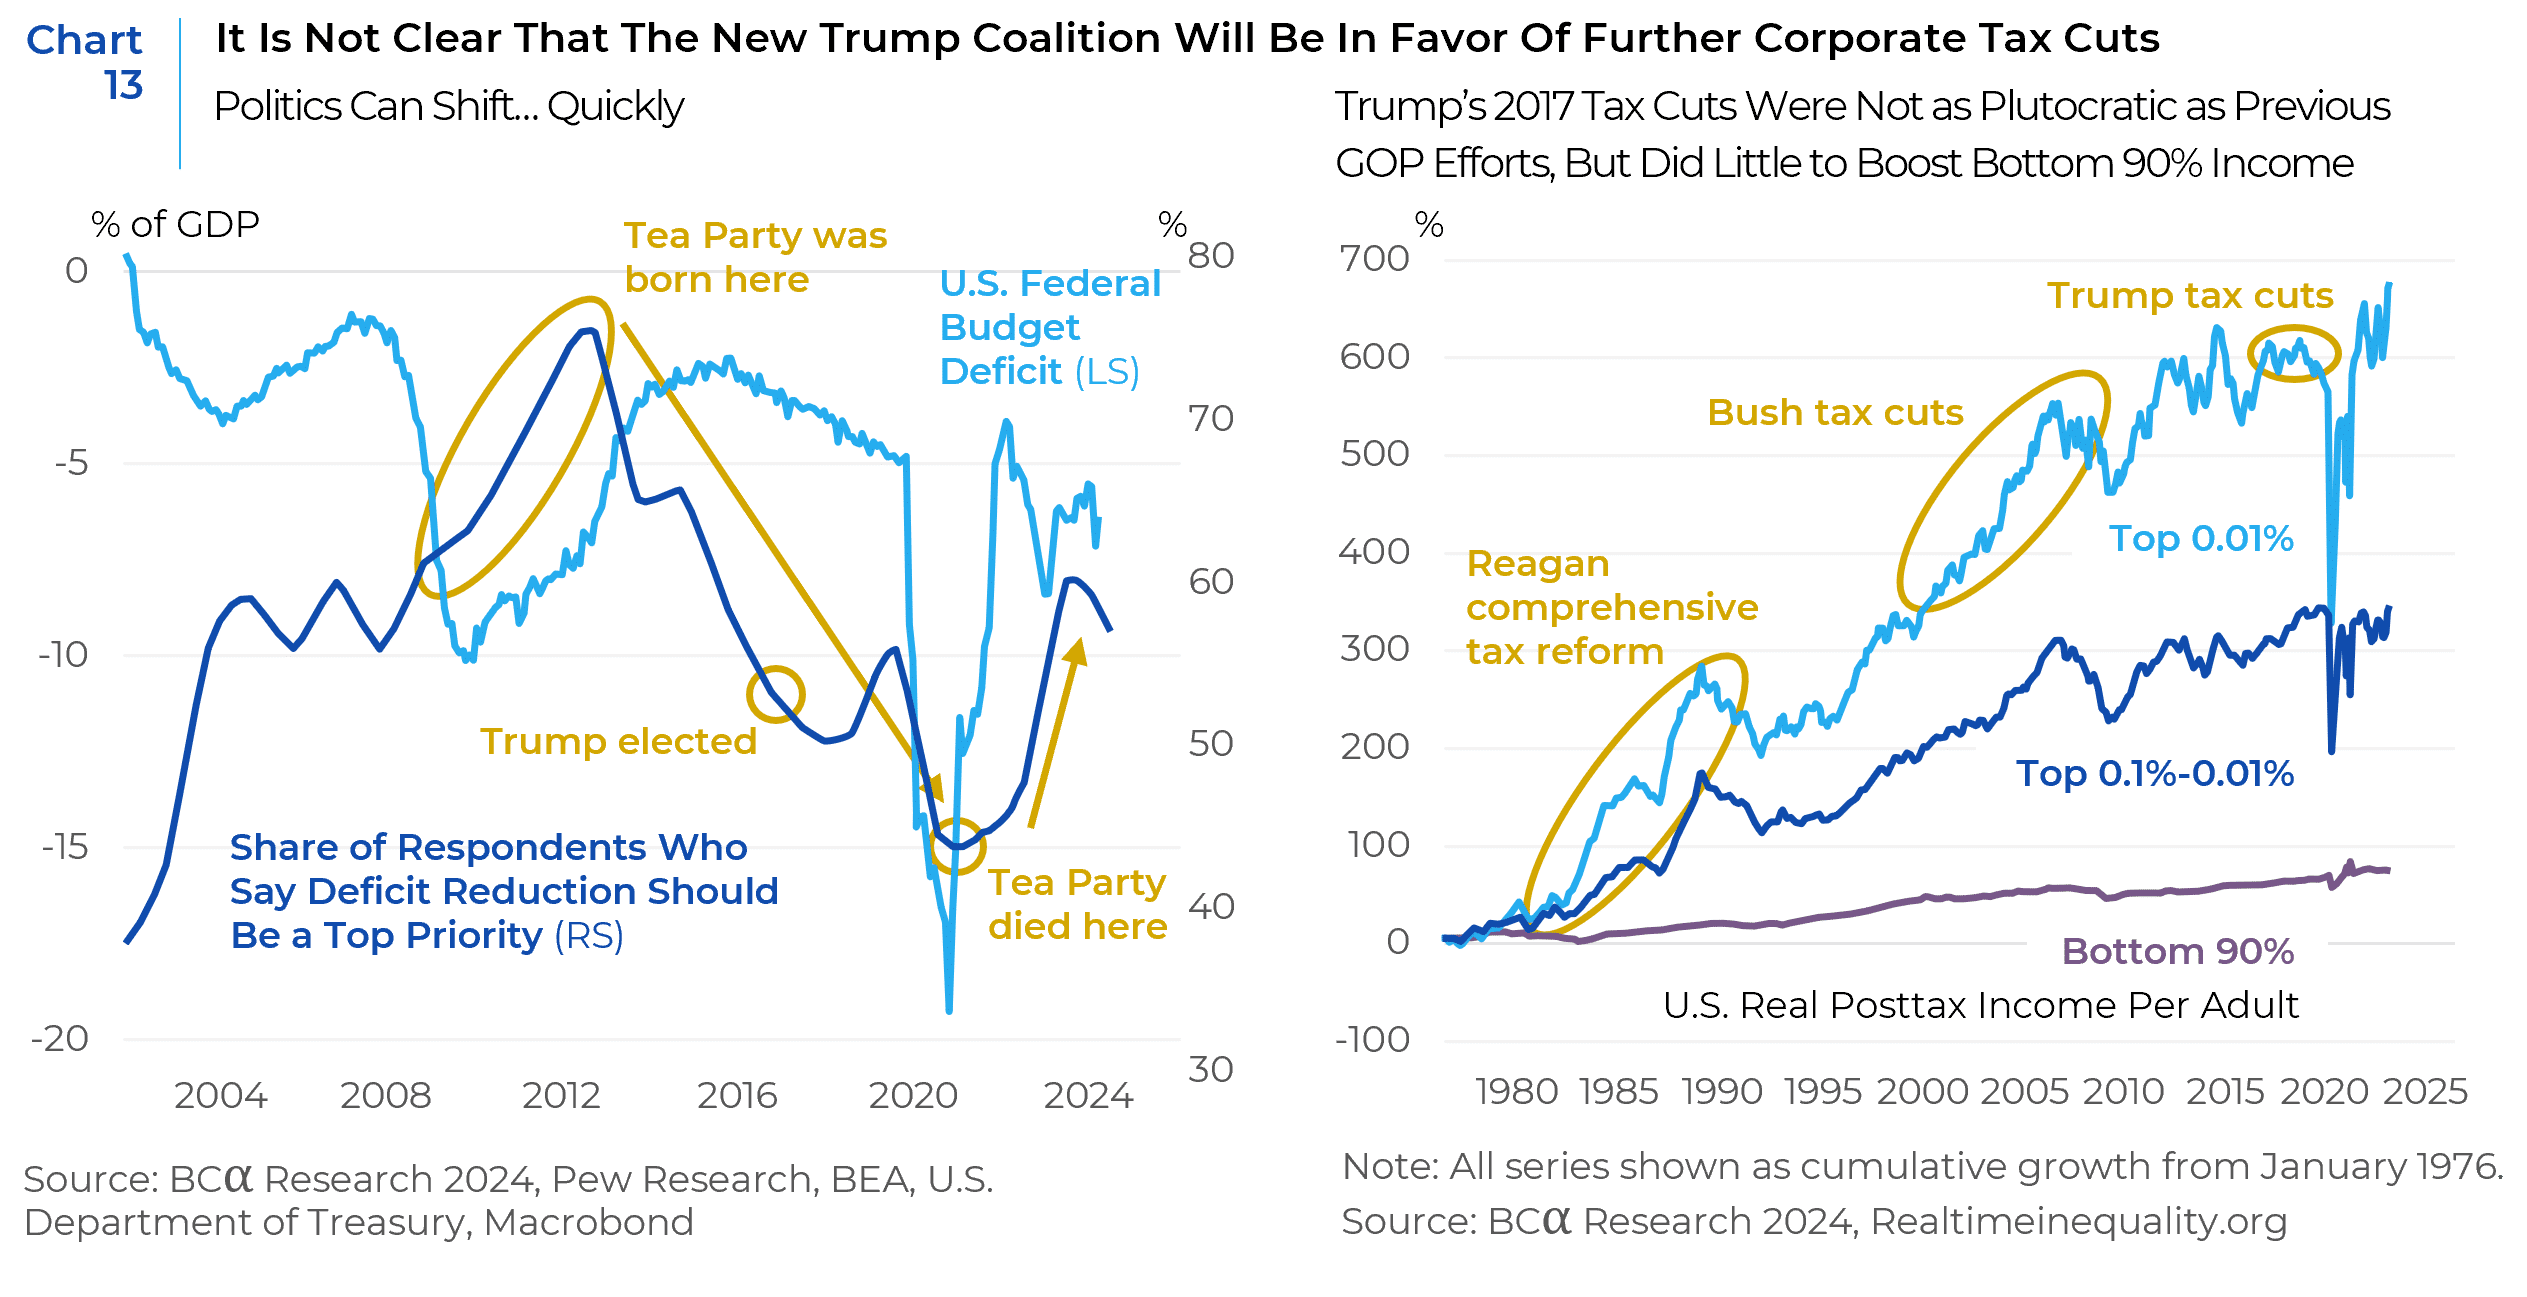
Without reliable offsets to tax cuts, Trump would need to woo an increasingly fiscally conservative Republican congress that has already shown its willingness to stand up to him (and Elon Musk) on budget issues. Though Trump may not feel so constrained by voter preferences, a still fragile congress will. Exit polls from the November election (Chart 12) put inflation as by far the number one issue on voters’ minds. Taxes placed in the middle of their priority list, and trade/tariffs were dead last. Therefore, support for both tariffs and further reductions in corporate taxes could run afoul of the growing resistance to overreach by billionaire plutocrats from the populist wing of the MAGA base (see Chart 13). The prevailing mood of the electorate may thus stiffen resistance to the threat of being “primaried” by President Trump’s formidable political machine.
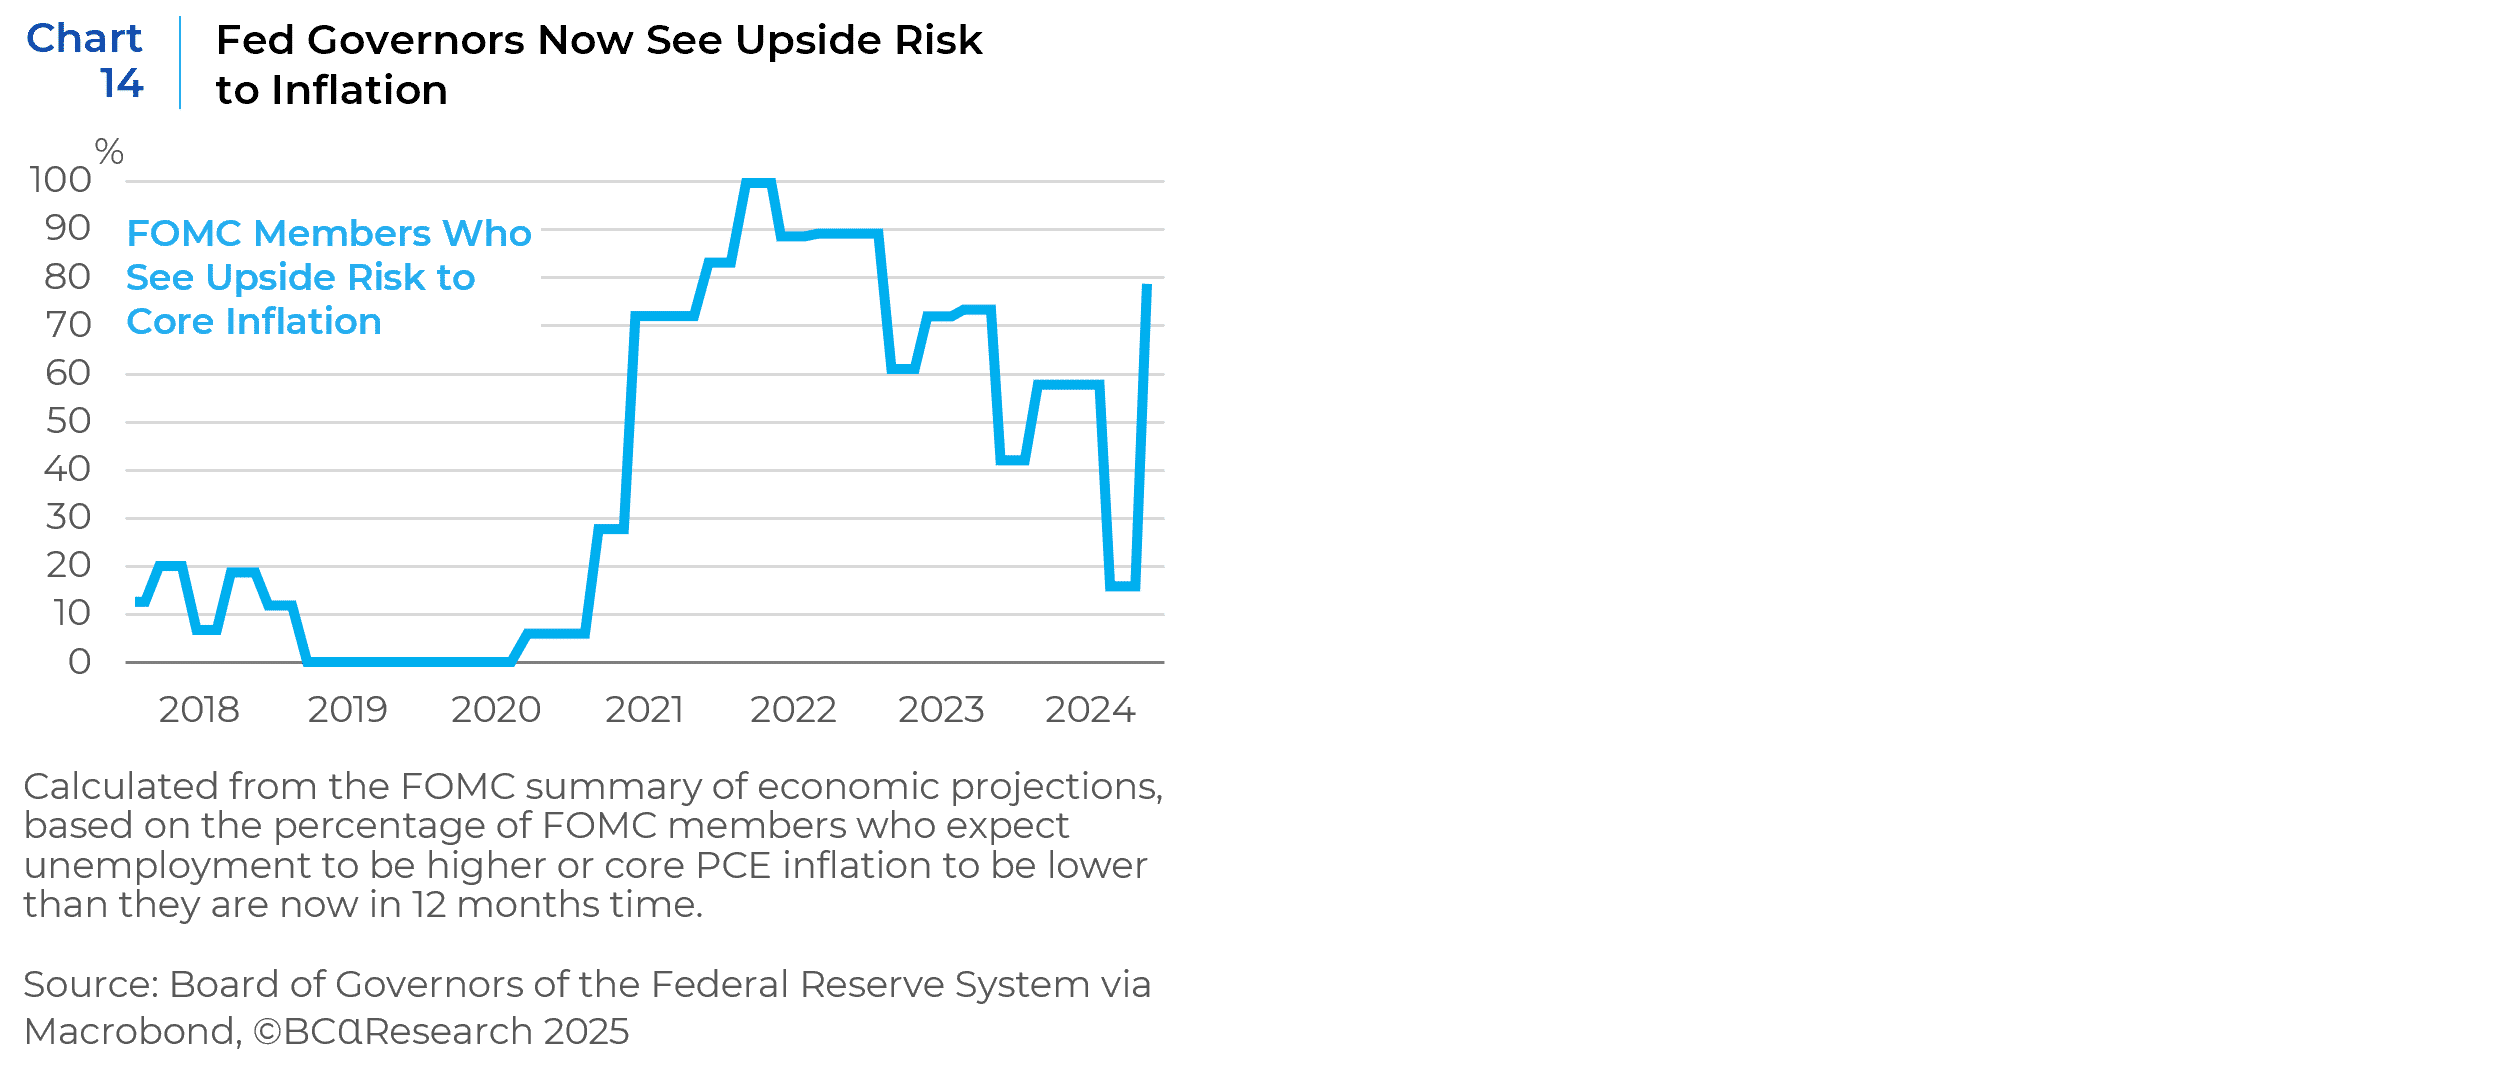
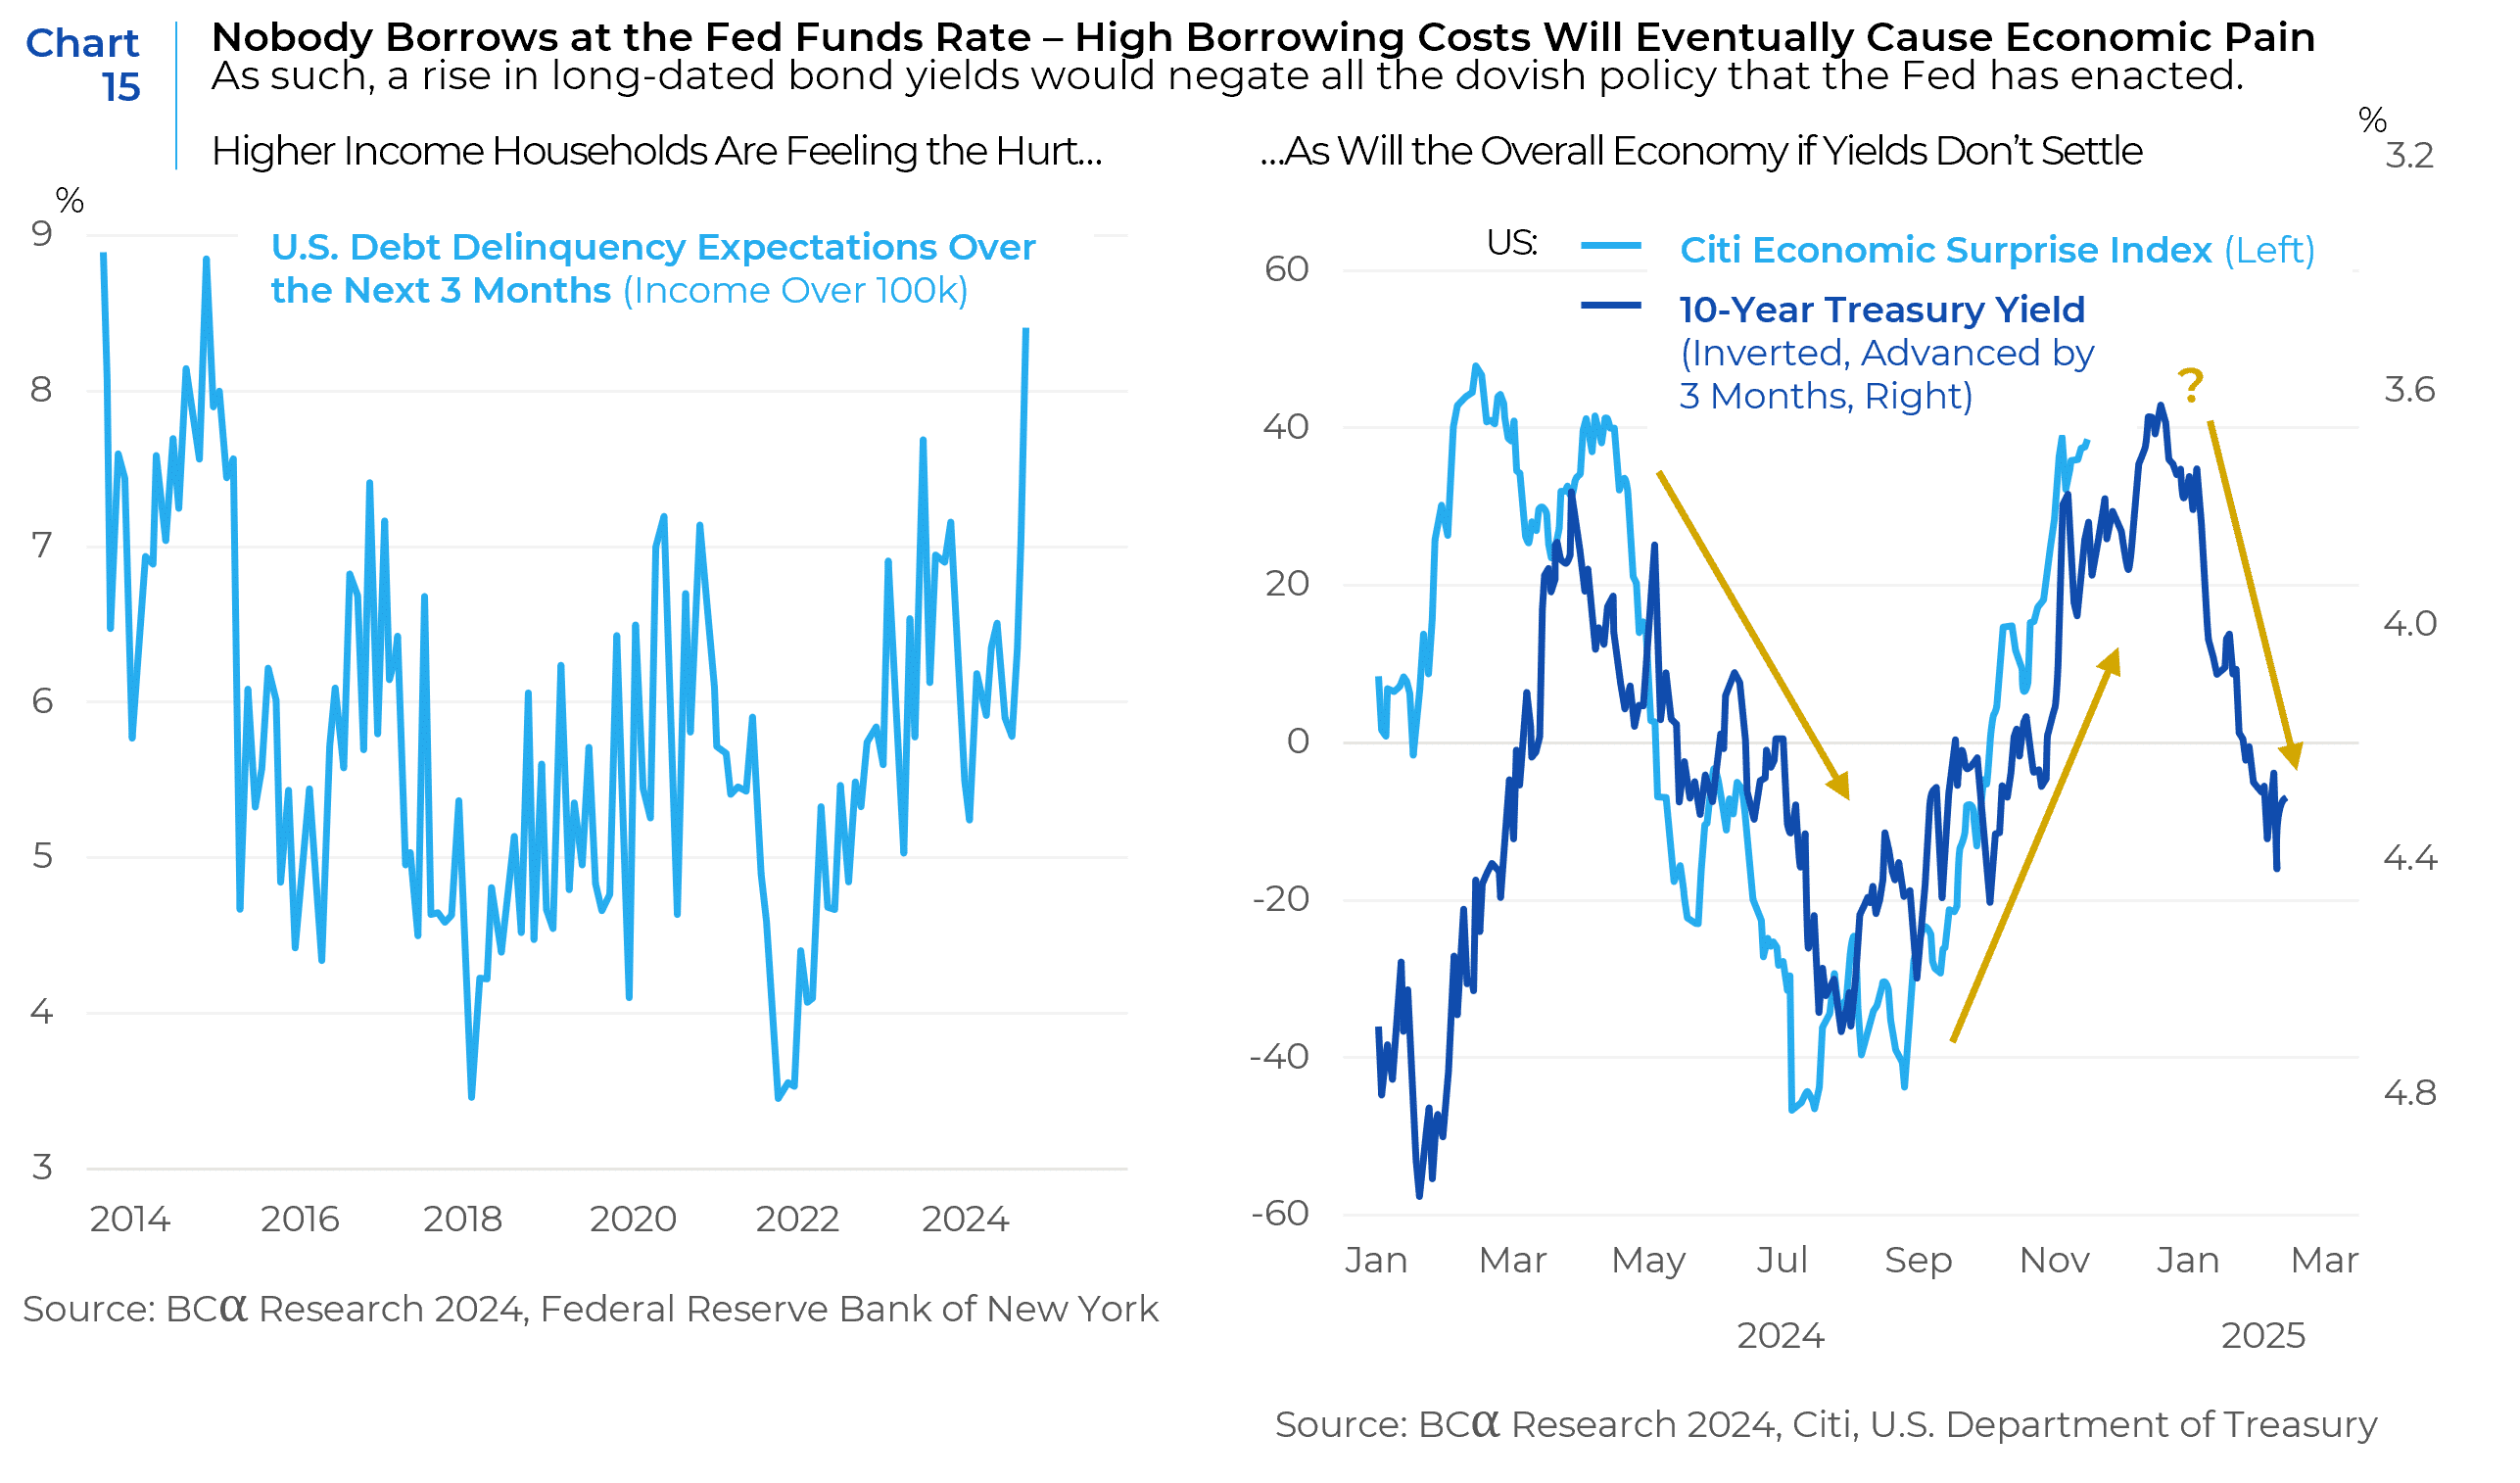
Even if Congress ignores voters’ wishes and caves to Trump’s maximalist fiscal platform, the bond market will not. When Trump first assumed the presidency in early 2017, the 10-year TIPS yield was close to zero and then fell into negative territory once the pandemic began. Consequently, the market simply did not care about large budget deficits. This is not the case anymore. As previewed last December, bond investors are increasingly unwilling to underwrite further fiscal largesse without more compensation. Thus, long-dated bond yields have moved sharply higher since the election in November, even as the Fed cut rates by 1% since September 2024, while debt delinquencies among high income households have surged. While Trump can perhaps afford to ignore such signals of stress, congressional Republicans cannot. Nor does it seem likely that a Wall Street veteran like Scott Bessent (Trump’s nominee for Treasury Secretary) will run roughshod over a rioting bond market. Already, there is a sharp turn in inflation expectations at the Federal Reserve, where 80% of FOMC members now see meaningful upside risks to inflation as compared to just 20% before the election (Chart 14). The double tightening of financial conditions via a falling stock market and rising bond yields will eventually weigh on economic activity. If this scenario bears out, bond yields would decline. Lower aggregate demand would prompt the Fed to cut rates more than is currently discounted (see Chart 15).
Conclusion & Summary
Given the myriad of political, fiscal, and market constraints, our base case scenario is for a substantially watered down Trump agenda on the critical economic and fiscal issues of his campaign. His ability to deport migrants will be constrained by both fiscal and logistical realities, while tax cuts will be constrained by tepid political support from Congress and bond investors. Whereas Trump has the fewest constraints in levying tariffs, he also has the least support from voters and would eventually have to confront the reality that tariffs are inflationary for U.S. consumers. These findings underpin our forward-looking views which call for a mid-2025 slowdown caused by the combination of lower business investment due to trade policy uncertainty against the backdrop of a weakening labor market and retrenching state and local budgets (that account for 45% of government expenditures) due in part, to reduced federal transfer payments.
In 2025, we expect continued outperformance of the U.S. dollar (which historically outperforms when growth is slowing) and U.S. equities over European and Emerging Market equities. Japanese equities are less exposed to the U.S. market and unlike the U.S. Japan is one of the world’s biggest creditor nations. The reason that Japan has run such large budget deficits in the past was not because the government was incapable or unwilling to raise revenue, but because every effort to tighten fiscal policy only served to worsen deflation. Moreover, the BOJ is the only developed market central bank which has not lowered interest rates, which could lead to a favorable interest rate differential during a global downturn.
Long bond yields will continue to trade in the 4% to 5% range unless a major default event or a bond market riot causes a significant risk-off event. At that point, long bond yields would return to a 3% to 4% range, credit spreads, that are already at the low end of their historical trading range, would widen, and the Fed would accelerate interest rate cuts. This would in turn provide a second wind to risk assets, such as corporate bonds, as well as small cap and value stocks.
Our asset class and sub-asset class views are summarized on Table 4 on pages 13 and 14. For a deeper dive on both their investment implications and proposed investment response, we have hyperlinked the outlooks provided by our team of seasoned asset class experts on the U.S. equities, U.S. fixed income, and global markets.
[1] https://www.gao.gov/products/gao-24-107487#:~:text=The%20Department%20of%20Health%20and,programs%20in%20fiscal%20year%202023
This report is neither an offer to sell nor a solicitation to invest in any product offered by Xponance® and should not be considered as investment advice. This report was prepared for clients and prospective clients of Xponance® and is intended to be used solely by such clients and prospective clients for educational and illustrative purposes. The information contained herein is proprietary to Xponance® and may not be duplicated or used for any purpose other than the educational purpose for which it has been provided. Any unauthorized use, duplication or disclosure of this report is strictly prohibited.
This report is based on information believed to be correct but is subject to revision. Although the information provided herein has been obtained from sources which Xponance® believes to be reliable, Xponance® does not guarantee its accuracy, and such information may be incomplete or condensed. Additional information is available from Xponance® upon request. All performance and other projections are historical and do not guarantee future performance. No assurance can be given that any particular investment objective or strategy will be achieved at a given time and actual investment results may vary over any given time.

