FORESIGHT | FIS VIEWS
Our latest Foresight’s research paper, explores our assertion that President Trump’s objective is not a full-blown trade war, but an attempt to renegotiate the U.S.’s trade package with China and to stymie China’s goal of gaining global technological leadership, as outlined in its “Made in China 2025 Initiative”. Long-term, we assert that the historical Sino-America economic symbiosis is frayed and in need of a coordinated rebalancing. However, because of complex supply chains, the administration’s tariff announcements, will if implemented, foster unintended consequences for allied nations. This paper also explores those potentially negative consequences and our view on how likely they are to occur, and who will be impacted.
A key tenet of this note is that President Trump and his trade warrior cohorts’ objective is not a full-blown trade war, but an attempt to renegotiate the U.S.’s trade package with China. Indeed, this battle is not about the US-China trade deficit, otherwise why were iPhones, which represent the largest single import item, excluded from the US Trade Representative list of 1300 product lines that would be subjected to new tariffs? Similarly, cheap imports of Chinese manufactured sofas and beds have decimated US furniture manufacturers and their employees which populate the Trump-voting regions in southeast and middle America. Yet they too were excluded from the list. The real objective is to prevent China from gaining global technological leadership. In the words of the US Trade Representative’s (USTR) office, the administration’s strategic aim is to frustrate China’s goal of dominating key strategic technologies as reflected in its “Made in China 2025” initiative, which was published back in 2015.1
Aside from a core mercantilist instinct, President Trump’s relative complacency on the potential fallout from a trade war is supported by the U.S.’ relative insularity (see Chart 1).
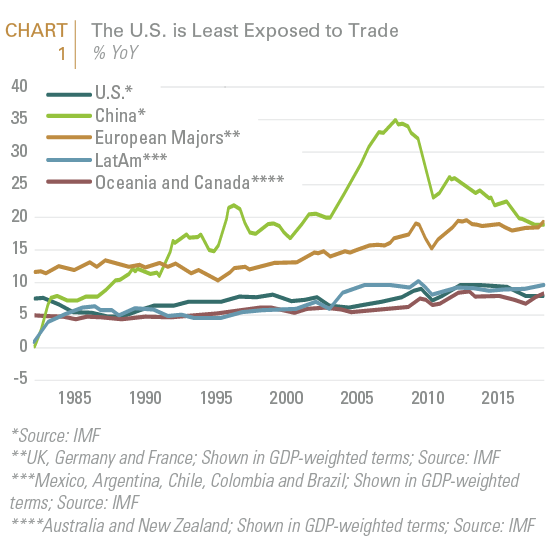
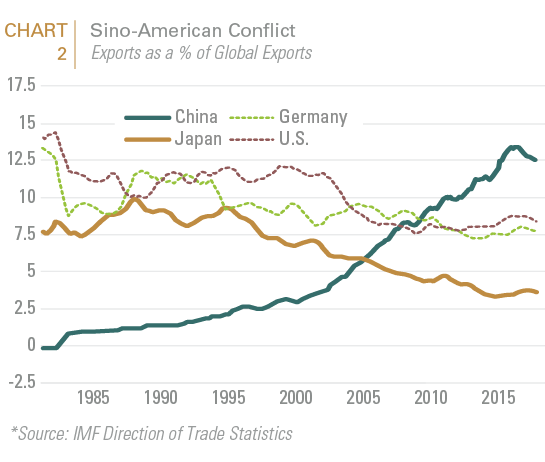
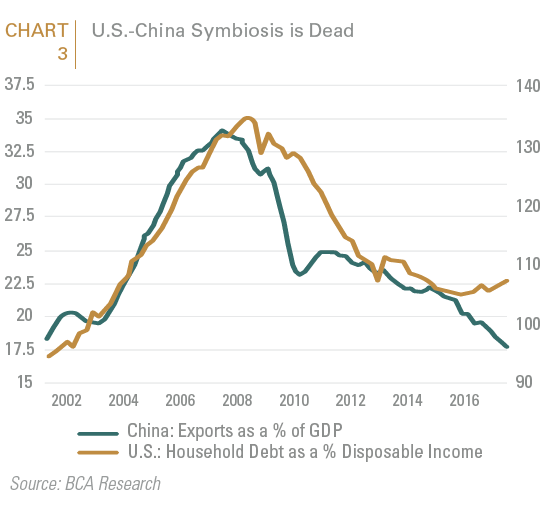
Additionally, his push to rebalance trade arrangements with China is not unwarranted. Indeed, the Sino-American symbiosis (America purchases/borrows & China exports/lends) which developed after China entered the WTO has become increasingly frayed. American consumers’ spendthrift habits were stymied by the 2008 credit crash and China’s efforts to increase domestic consumption (relative to production) will continue to reduce the importance of exports as a percent of its GDP. Both countries are not overwhelmingly dependent on globalization: exports account for 12% of US GDP and have declined to 19% of Chinese GDP (down from around 30% in the mid-2000s). Structurally, China will not be able continue to capture global market share while curtailing access to its vast domestic markets and exporting deflation; particularly now that its higher value exports are competing with developed market economies (see Chart 2 and Chart 3).
Chinese industrial policies are clearly a problem for the global trading system given the size of its economy. Xi’s state-directed economic model is reminiscent of growth strategies pursued by Korea and Japan in earlier decades, but it differs in that it is being implemented in a country with a huge domestic market that is already commercially sophisticated and that is being directed by an authoritarian political leadership.
The problem is that the administration’s tariff announcements have been ham-handed and if implemented, will foster unintended consequences for allied nations because of the complexity of global supply chains. For example, the steel and aluminum tariffs were poorly targeted in country terms and China will suffer little. The exemptions for Canada and Mexico were helpful but it shows the initiative was poorly thought through. But it has appropriately served to wake the market up from its complacency.
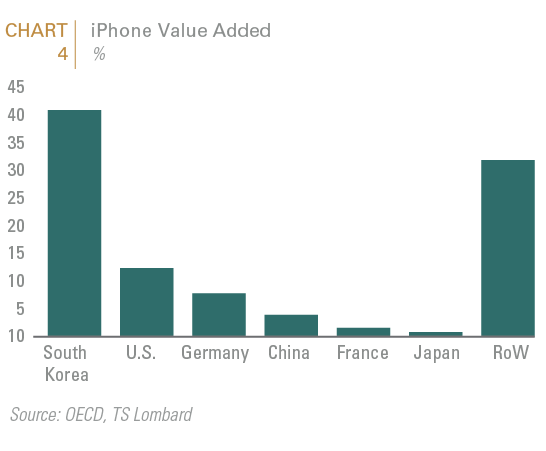
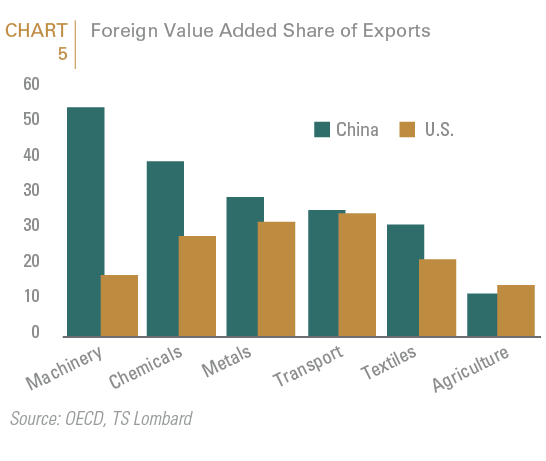
To illustrate the risk of unintended consequences Chart 4 shows the dispersed supply chain and value add for the iPhone, which accounts for about $20 billion of the US trade deficit. Chart 5 evaluates foreign value add as a % of exports. In the machinery sector for example, 50% of the input is from somewhere else, which would obviously be gravely impacted by punitive tariffs on Chinese imports.
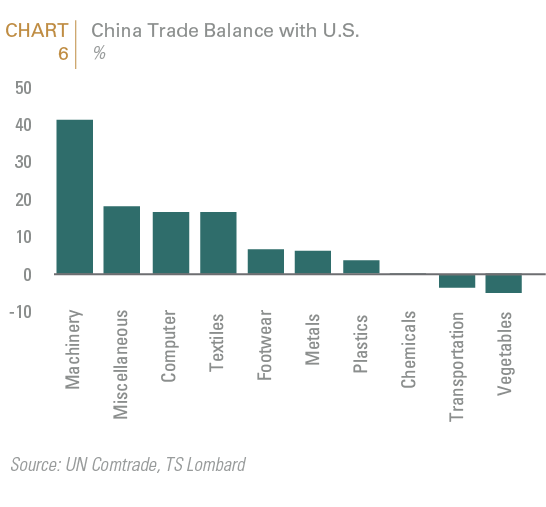
The list of products included on the US tariff list does not include products that Americans consume in great quantities and which primarily contribute to the trade deficit. It also excluded products that are likely to adversely affect price-sensitive US voters based on the stated criteria focusing on products that “benefit unfairly” from industrial policies of the Chinese government. China’s list of retaliatory tariffs unsurprisingly target US goods produced by these same US voters, such as soybeans and other agricultural exports where, as shown in Chart 6, the US has a positive trade balance with China. President Trump after all won eight of the top 10 soy- and hog-producing states. If the current conflict turns into a tit-for-tat trade war US farmers will be big losers in the longer run and Brazil and Argentina will be big winners.
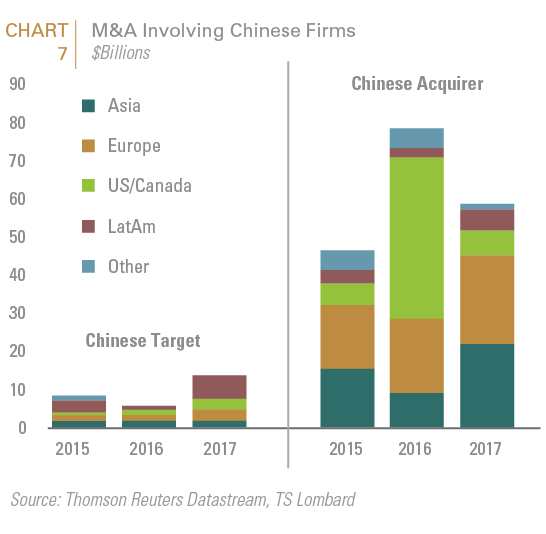
The USTR, however, is correct in recognizing the importance of China’s “Made in China 2025” policy because it is the lynchpin of Xi Jinping’s overarching longer-term political program. Moreover, the USTR Section 301 trade report alleged that Chinese intellectual property theft cost the US as much as $600 billion per year. Accordingly, the US administration’s unilateral strategy has a limited chance of preventing China from moving up the technological value chain. Chinese firms can easily sell products on the tariff list to the rest of the world. Making access to the US market more expensive via tariffs will hardly set back China’s relentless global acquisition of the latest technologies either via imports or homegrown R&D (see Chart 7). Moreover, blocking prospective Chinese acquisitions of US high-tech firms via the existing inter-agency Committee on Investment in the US (CFIUS) is already an option for the White House which does not need threats of tariffs to be utilized.
What lies ahead is not a trade war but negotiations. China will be able to assuage Trump’s mercantilist instincts by committing to take steps to reduce the bilateral trade imbalance between the two countries. This would give Trump a victory. It is less clear how negotiations over China’s industrial policies will proceed. China is unlikely to compromise on Xi Jinping’s goal of creating and protecting domestic champions in high-tech fields, which were enumerated in the “Made in China 2025” document. In the end, only a multilateral approach with broader Western controls on technology transfers via a repurposed WTO would stand a chance of success in influencing China’s industrial policies.
Reviewing the Winners and Losers of Increased Mercantilism
Increased tariffs will raise US consumer prices, which may depress final demand. This impact should, however, be offset by increased US capex spurred by the pick up in global growth and tax cuts. Hence, assuming that the US and China do not embark on a full trade war, the net effect should be a modest cut to growth and a small increase in inflation in both the US and China. Moreover, most intermediate goods shipped to China from the region are used for products sold domestically. Therefore, the collateral damage there should be limited. Recent estimates of the impact of targeted products range between 0.5% and 1.0%.
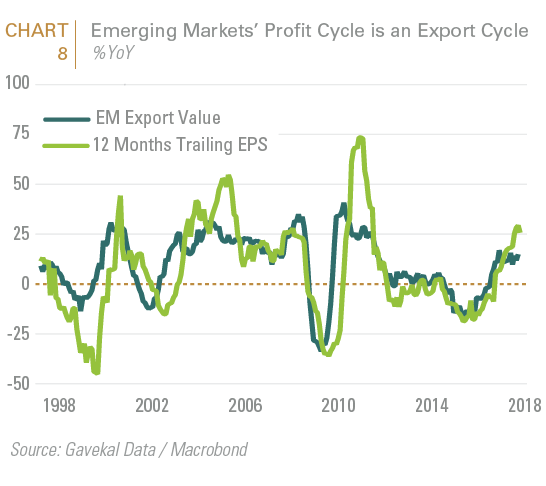
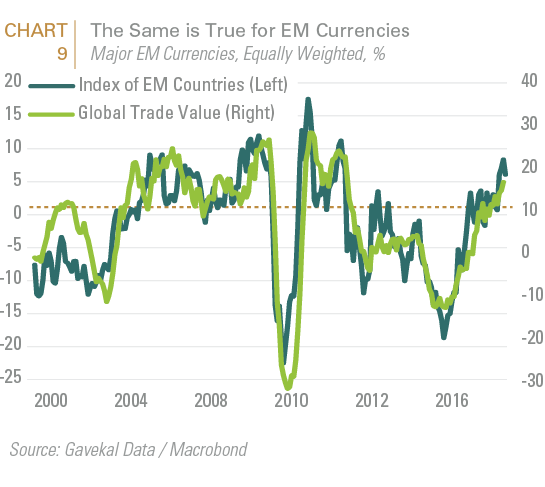
Structural growth in emerging markets depends on factors like productivity, leverage and politics. However, the cyclical element of profits boils down to an economy’s success in global export markets. Since the aftermath of the Asian crisis in the 1990s, there has been a tight correlation between EM exports and earnings. A similar dependency exists between emerging market currency values and global trade (see Chart 8 and Chart 9).
This is why emerging market equities initially bore the brunt of worries about protectionism when President Trump was elected. With Trump’s fiscal boost now discounted, investors have since focused solely on the potential damage from tariffs. Consequently, during Q1, US equities fell by more than emerging markets after Trump announced tariffs against China, and after China’s retaliation.
Chart 10 captures the supply chain linkages embedded in Chinese exports. With a wider trade war, whereby world trade volumes decline, South East Asia would be especially challenged.
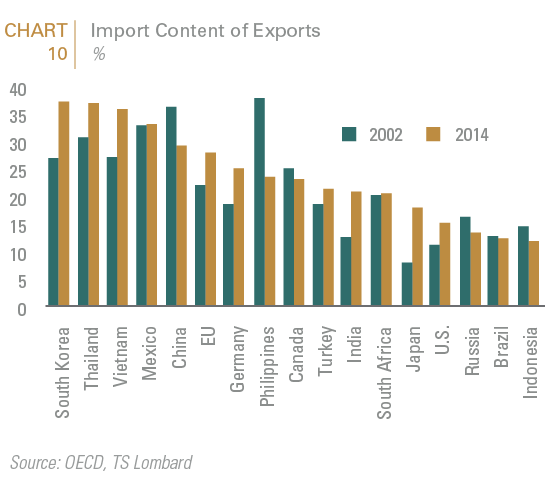
Specifically, in the ASEAN region, global trade is the lifeblood of their economies, with global exports amounting to 45% of GDP. Countries such as South Korea and Taiwan which derive 38% and 55% of their GDP from exports, respectively, would be particularly hard hit.
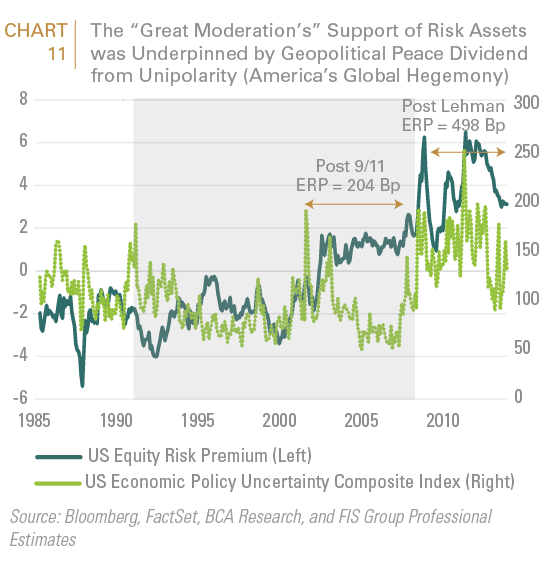
Long term, increased isolationism and mercantilism weakens 20th century institutions underpinning the post WWII Pax Americana which provided for a geopolitical “peace” dividend which supported risk assets (see Chart 11).
Historically, corporate profits and globalization have been positively correlated because as globalization intensifies, global trade links deepen and “borders fall,” boosting companies’ international revenue exposure. Typically, higher top-line growth from foreign markets has also been associated with increasing overall sales and profitability. De-globalization is also inherently inflationary (although structural demographic trends –older people consume less of most goods except for health care– will limit demand induced inflation). Additionally, less global trade of goods will lead to less cross border capital flows; which would in turn lead to less demand for US dollars as well as increased FX volatility as portfolio flows become less important.
Currently, global mercantilist policy impulses seem to be mostly concentrated in the White House, which should limit the probability of the aforementioned risks that presume a wider escalation of trade tensions beyond the U.S. Thankfully, these do not appear probable at present. Instead, the proximate threats of Trump’s mercantilist trade policy appear most likely to accrue to:
- Chinese exporters to the U.S., few of whom are among the more significant listed entities in the Chinese market;
- U.S. exporters to China, many of whom are listed large cap companies;
- U.S. multinationals with portions of their supply chain in China who are likely to at best see their prospects for further cost reductions stifled and at worst may experience expensive disruptions to their cross-border operations;
- Other multinational firms that have factories in China that in turn export to the U.S., and here we are especially cognizant of the risks to those Taiwanese mid-cap industrials that are part of the China-US supply chain, and by extension the Taiwanese banks that hold their debt.
Beyond the direct ramifications to these specific risk assets, fear of broader mercantilist impulses globally would generally be supportive of safehaven assets and more closed economies, such as the U.S. and China among major markets, which given the more direct risks enumerated above clearly portends further volatility amid risk assets in general. Meanwhile less trade dependent emerging markets, such as India, would be expected to benefit relatively from broader fears of general de-globalization.
1“President Trump Announces Strong Actions to Address China’s Unfair Trade.” Office of the United States Trade Representative. March 22, 2018. Press Release
This report is neither an offer to sell nor a solicitation to invest in any product offered by FIS Group, Inc. and should not be considered as investment advice. This report was prepared for clients and prospective clients of FIS Group and is intended to be used solely by such clients and prospects for educational and illustrative purposes. The information contained herein is proprietary to FIS Group and may not be duplicated or used for any purpose other than the educational purpose for which it has been provided. Any unauthorized use, duplication or disclosure of this report is strictly prohibited.
This report is based on information believed to be correct, but is subject to revision. Although the information provided herein has been obtained from sources which FIS Group believes to be reliable, FIS Group does not guarantee its accuracy, and such information may be incomplete or condensed. Additional information is available from FIS Group upon request.
All performance and other projections are historical and do not guarantee future performance. No assurance can be given that any particular investment objective or strategy will be achieved at a given time and actual investment results may vary over any given time.