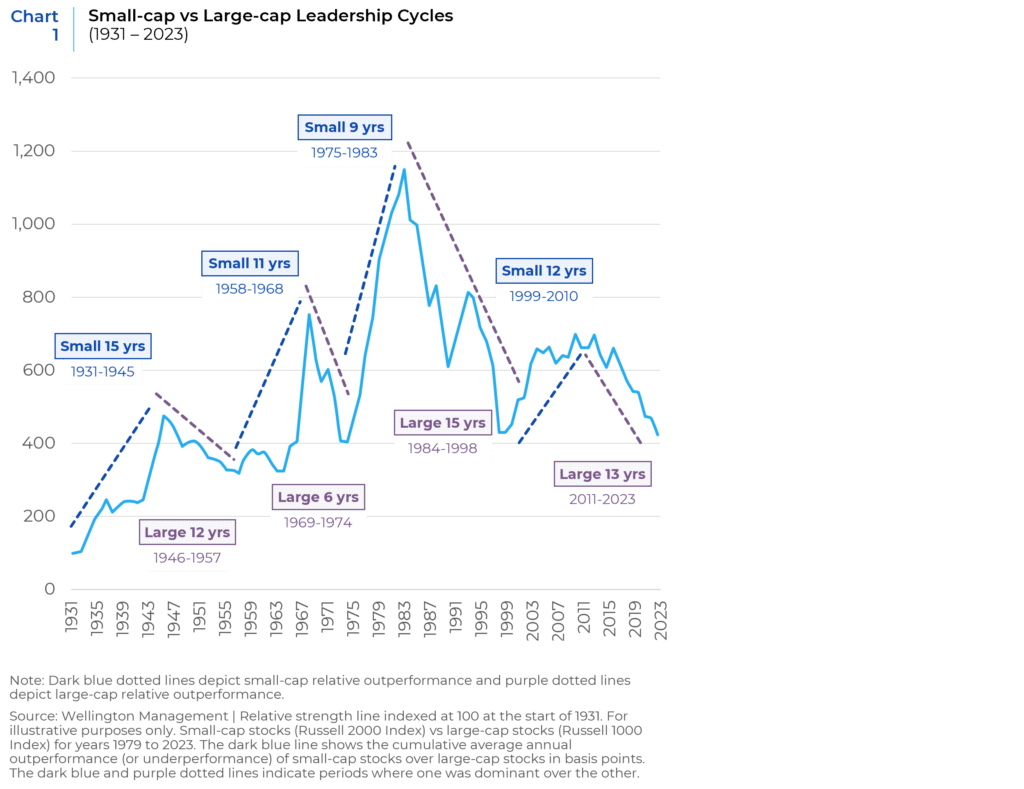
Large Cap companies have dominated their smaller brethren since the end of the Great Financial Crisis in 2008. After the economy started recovering from the crisis in 2009, market leadership was initially powered by small names but as the recovery stabilized, larger names started to gather strength and have been on a tear since. With more than 13 years of large cap leadership on the books, it may be time for a change. Historically, the leadership baton has been passed back and forth between large and smaller names over the years, as seen in Chart 1 below. Is there a potential for a resurgence in the performance of SMID Cap and Small Cap stocks and the consequent opportunity for the baton to be passed again?

Valuation Divergence
A large divergence in the valuation of Large Caps versus SMID and Small Caps and the probability of a reversion to the mean makes smaller companies looks attractive from an investment standpoint. As shown in Chart 2 and Chart 3 below, the dispersion in valuation levels for SMID and Small Caps when compared to large cap names, are at extremes. Relative Valuations for SMID Caps and Small Caps versus their Large Cap brethren using Enterprise Value to Earnings before Interest and Taxes are near their lowest in 25 years.

At current levels, SMID and Small Cap stocks are already priced at valuations that would account for the worst case scenario in the middle of a recession. The principle of reversion to the mean suggests significant gains for these stocks as they have priced in all the risks, creating a unique situation with reduced downside and increased upside potential.
Slowing Economy
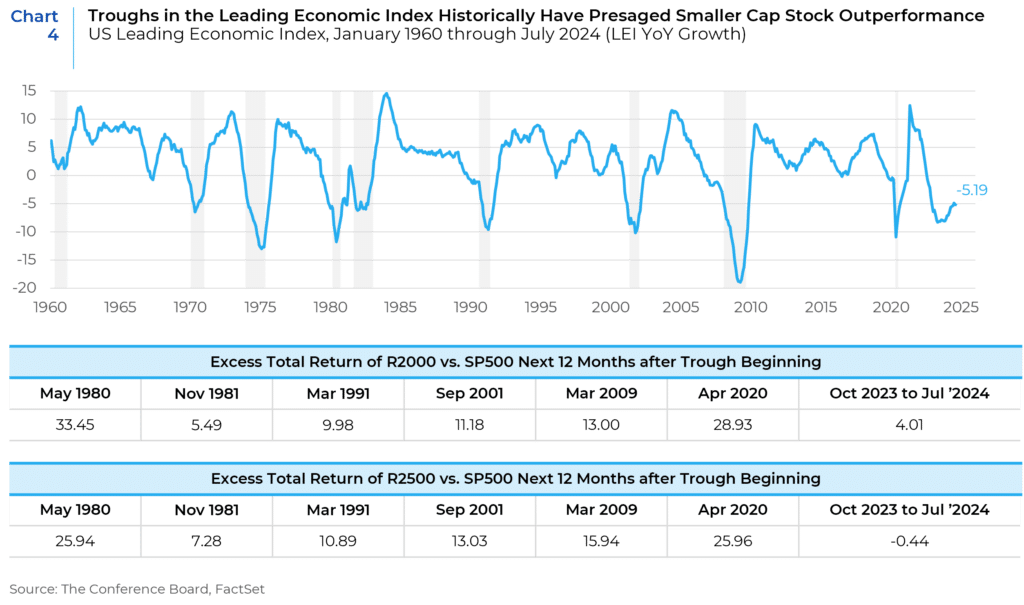
The U.S. economy started 2024 with stronger-than-anticipated inflation and employment. Market expectations for monetary accommodation consequently diminished significantly in the first half of the year. As the second half of the year progresses, moderating economic indicators point to a potential slowdown that may have taken hold a few months ago. The lagged effects of tight monetary policy are becoming apparent in trends in various economic indicators. Though by no means foolproof, troughs in the Conference Board’s Leading Economic Index (LEI) historically have signaled better performance of smaller cap stocks relative to large caps, as illustrated in Chart 4 and the accompanying table. Recent LEI data suggests the metric may be bottoming after a long period of decline, partly due to indications of cooling inflation. The first signs of a recovery in the performance of smaller names are also starting to become apparent.

When the economy recovers from a slowdown or recession, smaller company stocks often rebound quicker and can grow faster than large-cap stocks. Historically, indices like the Russell 2000 and Russell 2500 outperform the Russell 1000 during these periods, even before the recession ends. Smaller companies usually underperform before a slowdown, begin to outperform midway through, and excel as the economy turns around. If the signs of an economic slowdown become more pronounced in the coming months, smaller stocks might start outperforming soon.
Rate Cuts
SMID Cap and Small Cap companies are expected to benefit from the Fed’s anticipated rate cuts in September and beyond.
Rates Can Be a Tailwind for Smaller Companies: Smaller companies do not have the same level of access to external debt financing as their larger brethren. They also rely more on floating-rate and short-maturity debt to finance their business operations. When the Fed tightens monetary policy by raising interest rates, smaller firms face a significantly higher cost of capital, and this can adversely impact their profitability. However, when the Fed starts to ease monetary conditions by cutting interest rates, smaller firms benefit more from improved credit conditions than large firms.
Borrowing Costs: Compared to larger companies, SMID and Small companies typically face higher borrowing costs due to their higher perceived risk. Lower interest rates allow these companies to borrow at cheaper rates, reducing their cost of capital. Access to low-cost funds can help these companies finance additional investments and manage debt more efficiently, potentially leading to higher growth rates.
Consumer Spending: Lower interest rates benefit consumers by making loans and credit more affordable, leading to increased consumer spending. This directly boosts revenues for companies. SMID and Small companies, being more domestically focused, are typically more sensitive to changes in domestic consumer behavior compared to larger multinational corporations.
Investor Risk Appetite: In a low interest rate environment, returns on fixed-income investments like bonds are lower. This often drives investors to seek higher returns in equities, including SMID and Small Cap stocks, which are generally more volatile, but may offer the potential for higher returns.
Mergers & Acquisitions Activity: The combination of declining inflation and anticipated rate cuts is expected to rejuvenate deal-making. Companies utilize M&A to stimulate growth, gain competitive advantages, or influence supply chains. SMID and Small Cap companies are natural beneficiaries of increased deal activity and are often prime targets for private equity investments.
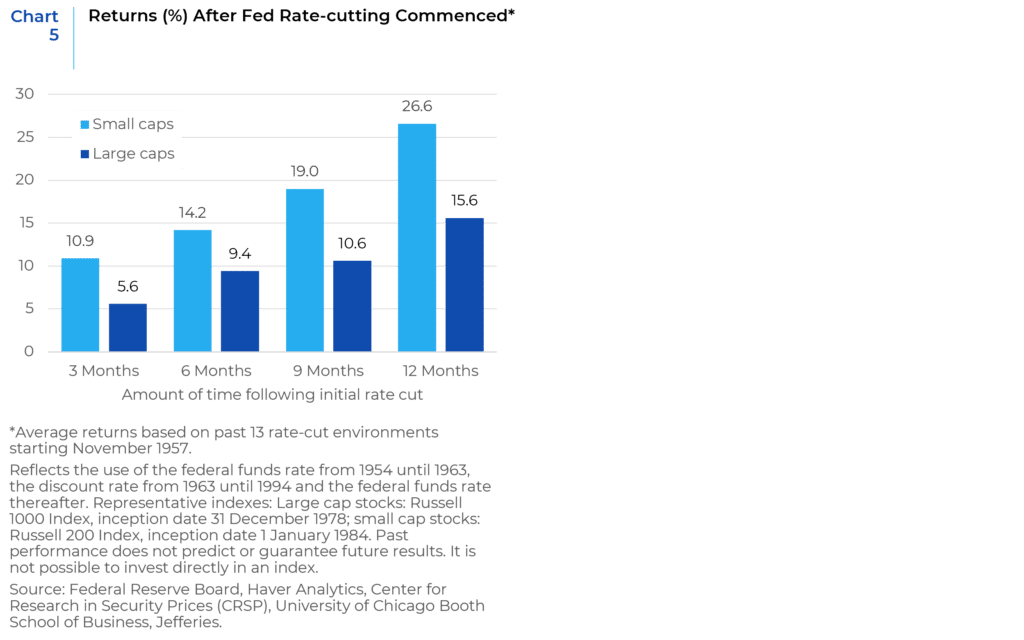
Historically, small cap stocks have outperformed large caps following the first move in a Fed rate-cutting cycle (Chart 5) because of all the reasons outlined above.

Earnings Trends
Another potential positive for smaller companies is that they are carrying less earnings risk relative to large caps. That’s mainly due to the current strength of the U.S. dollar. On average, smaller companies generate about 20% of their revenue outside the U.S., while large-cap companies make about a third of their revenue overseas. The growing value of the dollar is a headwind to earnings, it forces earnings to come down. It’s a much bigger problem for large-cap stocks.
Based on analyst estimates, earnings acceleration in smaller companies has the most potential to ignite and sustain a rally in these names in the coming months.

Presidential Elections
Another near-term tailwind for smaller names is the upcoming presidential election. Presidential election years have historically signaled good times for small-cap stocks.

De-globalization and Onshoring
The rising trend of de-globalization can be another factor that works in favor of smaller companies. Global supply chain dependencies are coming under scrutiny on the back of supply disruptions arising from the coronavirus pandemic and geopolitical tensions. The US and other countries are starting to look at increasing self-sufficiency in certain areas, and the pressure to shift supply chains closer to home continues to intensify. As China’s share of global manufacturing rose from 3% in 1990 to 25% more recently, it had contributed to a wave of anti-globalization-well before the pandemic, but COVID-19 has turbocharged the trend. This will favor smaller, domestically oriented companies, and brighten their prospects. Recent U.S. legislation creating incentives and subsidies for strategic industries has proven to be a further accelerant to onshoring, including the CHIPS and Science Act, the Inflation Reduction Act, and the Defense Production Act. The capital spending on the factories being built represents a fraction of the total spend when considering the surrounding infrastructure that is often required. Roads and services—both public and private—may meaningfully create or expand communities. Smaller, domestic companies are likely to disproportionately benefit because of their flexibility to adapt and respond quickly. This is a distinctive tailwind for small and midsize companies that can be expected to play out over many years.
Conclusion
The latest relative performance cycle of large cap dominance versus mid and small cap underperformance encompasses the bulk of the zero interest rate, easy money epoch, the covid pandemic and its aftermath, and the fastest rate of increase in interest rates in U.S. history. In other words, the cycle has featured three anomalous occurrences—along with a larger-than-usual dose of uncertainty. Against the backdrop of moderating inflation, normalized interest rates, and perhaps a soft landing engineered by the Fed, valuations for businesses that have lagged or largely sat out the mega-cap outperformance administration remain likeliest to rise. In July we saw some evidence of this as the Russell 2000 advanced 10.2% and the Russell Microcap increased 11.9% versus a gain of 1.5% for the Russell 1000 and respective losses of -0.4% and -0.7% for the Russell Top 50 and Nasdaq stocks. This rotation may be the first sign of a resurgence in SMID and Small Cap stocks and a potential change in market leadership and could serve as a tailwind for smaller stocks towards the end of 2024 and into 2025 and beyond.
This report is neither an offer to sell nor a solicitation to invest in any product offered by Xponance® and should not be considered as investment advice. This report was prepared for clients and prospective clients of Xponance® and is intended to be used solely by such clients and prospects for educational and illustrative purposes. The information contained herein is proprietary to Xponance® and may not be duplicated or used for any purpose other than the educational purpose for which it has been provided. Any unauthorized use, duplication or disclosure of this report is strictly prohibited.
This report is based on information believed to be correct, but is subject to revision. Although the information provided herein has been obtained from sources which Xponance® believes to be reliable, Xponance® does not guarantee its accuracy, and such information may be incomplete or condensed. Additional information is available from Xponance® upon request. All performance and other projections are historical and do not guarantee future performance. No assurance can be given that any particular investment objective or strategy will be achieved at a given time and actual investment results may vary over any given time.

