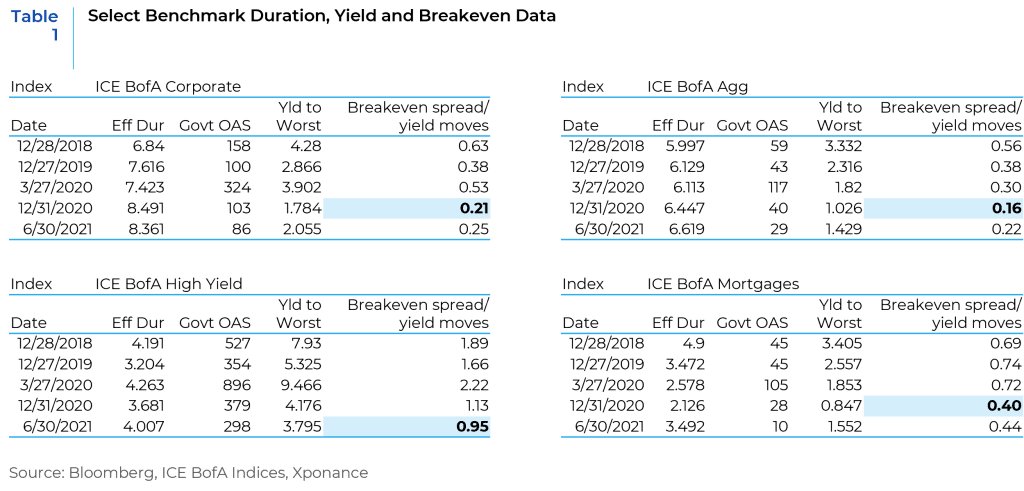
To be sure, valuations are stretched, especially if we look at each broad fixed income sector from a yield breakeven perspective (meaning the increase in spreads or rates that causes price return to overwhelm the yield for a given sector or instrument), as we often do in our outlooks. High grade credit appears to be fully valued on a range of other measures as well, though broad fundamental credit metrics are improving from the pandemic influenced lows. Leverage and coverage measures have improved as EBITDA has recovered, and margins have expanded as well. Clearly, there is variation among subsectors of the corporate indices, but this is also an opportunity to differentiate between companies that have been the beneficiaries of the reach for yield in liquid corporates versus issuers that have strong underlying fundamentals (especially at similar spread levels). In fact, even the less liquid corners of the liquid corporate markets have experienced significant spread tightening, with dispersion of spreads in the index at low levels. Though this is to be expected when credit spreads are extremely compressed, dispersion is quite low even as compared to previous periods with very tight spreads.
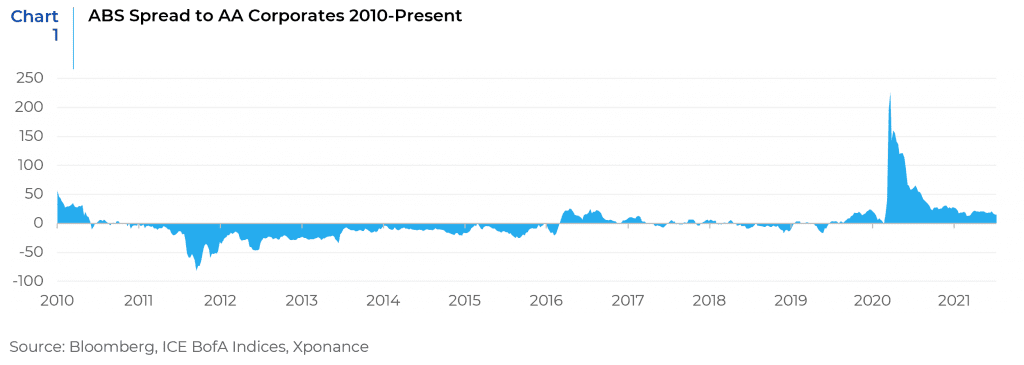
The wave of liquidity in corporate markets has not fully extended to less frequently traded sectors of the fixed income marketplace, however. This condition has presented valuation anomalies and thus investment opportunities. Many asset-backed securities, for example, provide a significant yield pickup to corporate bonds for a given maturity and rating level. Historically, other than during the Great Financial Crisis and the early days of the COVID-19 pandemic, ABS has traded at the same level or even tighter than similar credit instruments (especially at higher rating levels). We present broad data here to make the point, but this phenomenon extends to much of the ABS market in even more pronounced terms once we get below the headline level. Single-A and triple-B ABS, for example, has spreads that are nearly double that of a similar maturity corporate.

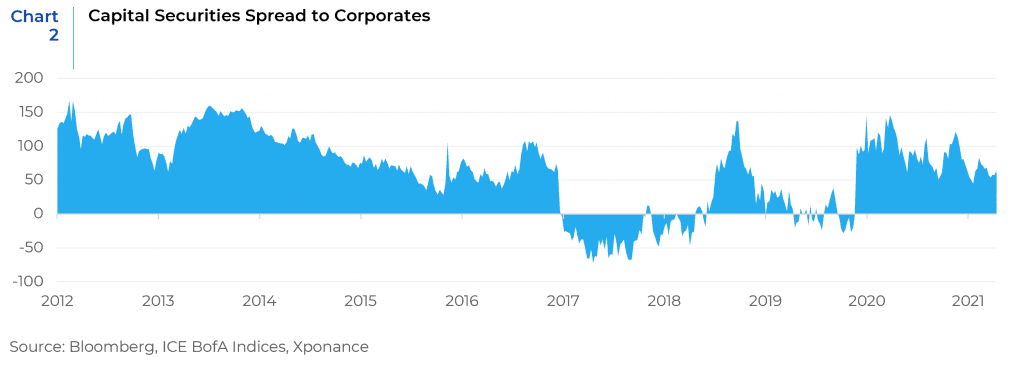
Similarly, capital securities are still trading very cheaply as compared to corporate bonds. We attribute some of this to a desire on the part of many investors to stay very liquid to provide for easier exit should the need arise. We would take a different view, in that one can pick up significant yield by investing in a different part of the capital structure of fundamentally sound and improving companies. And while the spread to corporates is not as high as it was immediately post pandemic, it remains attractive, both in relative and absolute terms. The yield-to-worst for the All Capital Securities index is currently above 2.6% for a low investment grade rating and a fairly short option-adjusted duration around 4.7 years. This compares to roughly 1.3% yield for the Aggregate with a duration of about 6.5 years and just under 2% yield for the broad corporate index at a duration over 8 years! There are structural risks in capital securities, but the risk reward construct is more balanced than that of straight corporate bonds, in our opinion.

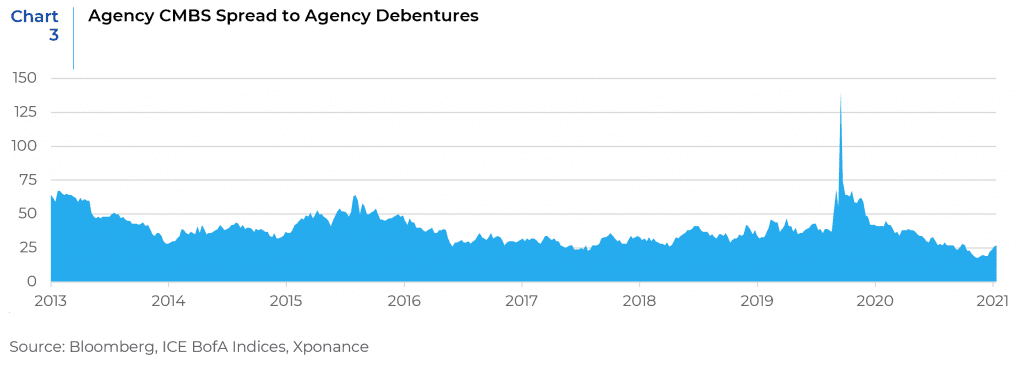
U.S. Agency securities have witnessed a similar liquidity wave to corporates, taking agency spreads to the tightest on record (low single digit spreads, ~3bps, to U.S. Treasuries). U.S. Agency CMBS (multifamily mortgage securities) provide a reasonable yield pickup to an unsecured agency paper, however, and present another relatively compelling investment opportunity without increasing the risk of the portfolio. In fact, despite some arcane technical points, one can easily make the argument that these securities are a better credit instrument than unsecured agency debentures. While they are somewhat less liquid than agency paper, they are easily sold should the need arise. While traditional agency single family MBS is likely the first thing the Fed will allow to taper when that process begins, we think this will have minimal impact on the agency multifamily market.

From an outlook perspective, benchmark returns for the remainder of the year will be driven by two main and obvious factors, interest rates and credit spreads. With nearly 40% of the Bloomberg Barclay’s Aggregate market value composed of Treasuries and 30% credit (and an even larger percentage for each on a duration basis, around 43% and 41% respectively) further moves in rates will drive both sectors. We have a hard time seeing corporate spreads moving much tighter from here. The improving credit fundamentals are essentially fully priced in, leaving little room for error in terms of corporate financial performance. Reducing risk in corporates seems prudent. From a macroeconomic perspective, we have already seen the high-water mark for fiscal stimulus, so GDP will continue to slow from here, and consensus forecasts call for a return to pre-pandemic growth levels (i.e. ~2%) by 2023. Clearly, the Federal Reserve will drive near-term rate volatility though tapering decisions. More importantly, though, will be the inflation outlook and the question of whether investors will continue to accept real negative yields in perpetuity. We think a move to a higher volatility regime could be the result of financial conditions staying too easy for too long, therefore creating instability in peripheral markets that bleeds into traditional real-money markets.
As we noted, however, there are pockets of relative value that remain for traditional fixed income investors. Notably, several of these are reasonably defensive and should be less affected by a mild market sell-off than the more liquid markets that have seen large inflows. As is so often the case when complacency is a feature of the market, being judicious in both sector and security selection is the key to generating alpha. Though total returns are still negative for both the Aggregate and Corporate indices through 6/30, the market has regained much of what was lost in 1Q21. Excess returns are now positive, but we think third quarter could be in for a bumpy ride when investors return to their desks (in an office setting) post Labor Day.
This report is neither an offer to sell nor a solicitation to invest in any product offered by Xponance® and should not be considered as investment advice. This report was prepared for clients and prospective clients of Xponance® and is intended to be used solely by such clients and prospects for educational and illustrative purposes. The information contained herein is proprietary to Xponance® and may not be duplicated or used for any purpose other than the educational purpose for which it has been provided. Any unauthorized use, duplication or disclosure of this report is strictly prohibited.
This report is based on information believed to be correct, but is subject to revision. Although the information provided herein has been obtained from sources which Xponance® believes to be reliable, Xponance® does not guarantee its accuracy, and such information may be incomplete or condensed. Additional information is available from Xponance® upon request. All performance and other projections are historical and do not guarantee future performance. No assurance can be given that any particular investment objective or strategy will be achieved at a given time and actual investment results may vary over any given time.

