As we approach the end of 2024, market volatility persists, with the market narrative frequently shifting in response to new economic data releases. Throughout the past year, we have anticipated that the economy, and consequently the fixed income markets, were at an inflection point. We now believe that this moment has finally arrived. But what does this mean for fixed income markets and portfolio decisions in the fourth quarter of 2024 and beyond?
We begin with a recap of what has proven to be one of the most consequential quarters for interest rate movements since the Federal Reserve began its tightening campaign in the first quarter of 2022. Given that futures-implied pricing of subsequent monetary policy moves is generally only accurate close to the actual move, we have extended our analysis by examining the shape of the yield curve in the context of previous monetary policy regimes.
Considering the tightness of corporate credit spreads across various ratings categories, we have also analyzed the shape of both corporate spread curves and corporate yield curves. Additionally, we note that with credit spreads at cyclical lows and dispersion very limited, certain market sectors are extremely overvalued compared to their historical trading ranges. Finally, we will synthesize these themes and observations into an outlook and strategy moving forward.
The third quarter of 2024 was certainly eventful for the US yield curve, as rates dropped dramatically across the curve (see Table 1, below). This was due not only to the 50 basis point reduction in the Federal Funds Target Rate (FDTR) at the September Federal Open Market Committee (FOMC) meeting, but also to the anticipation of a much easier monetary policy regime going forward. Consequently, 3Q24 ranks among the largest quarterly downward moves for the entire yield curve over the past twenty years.
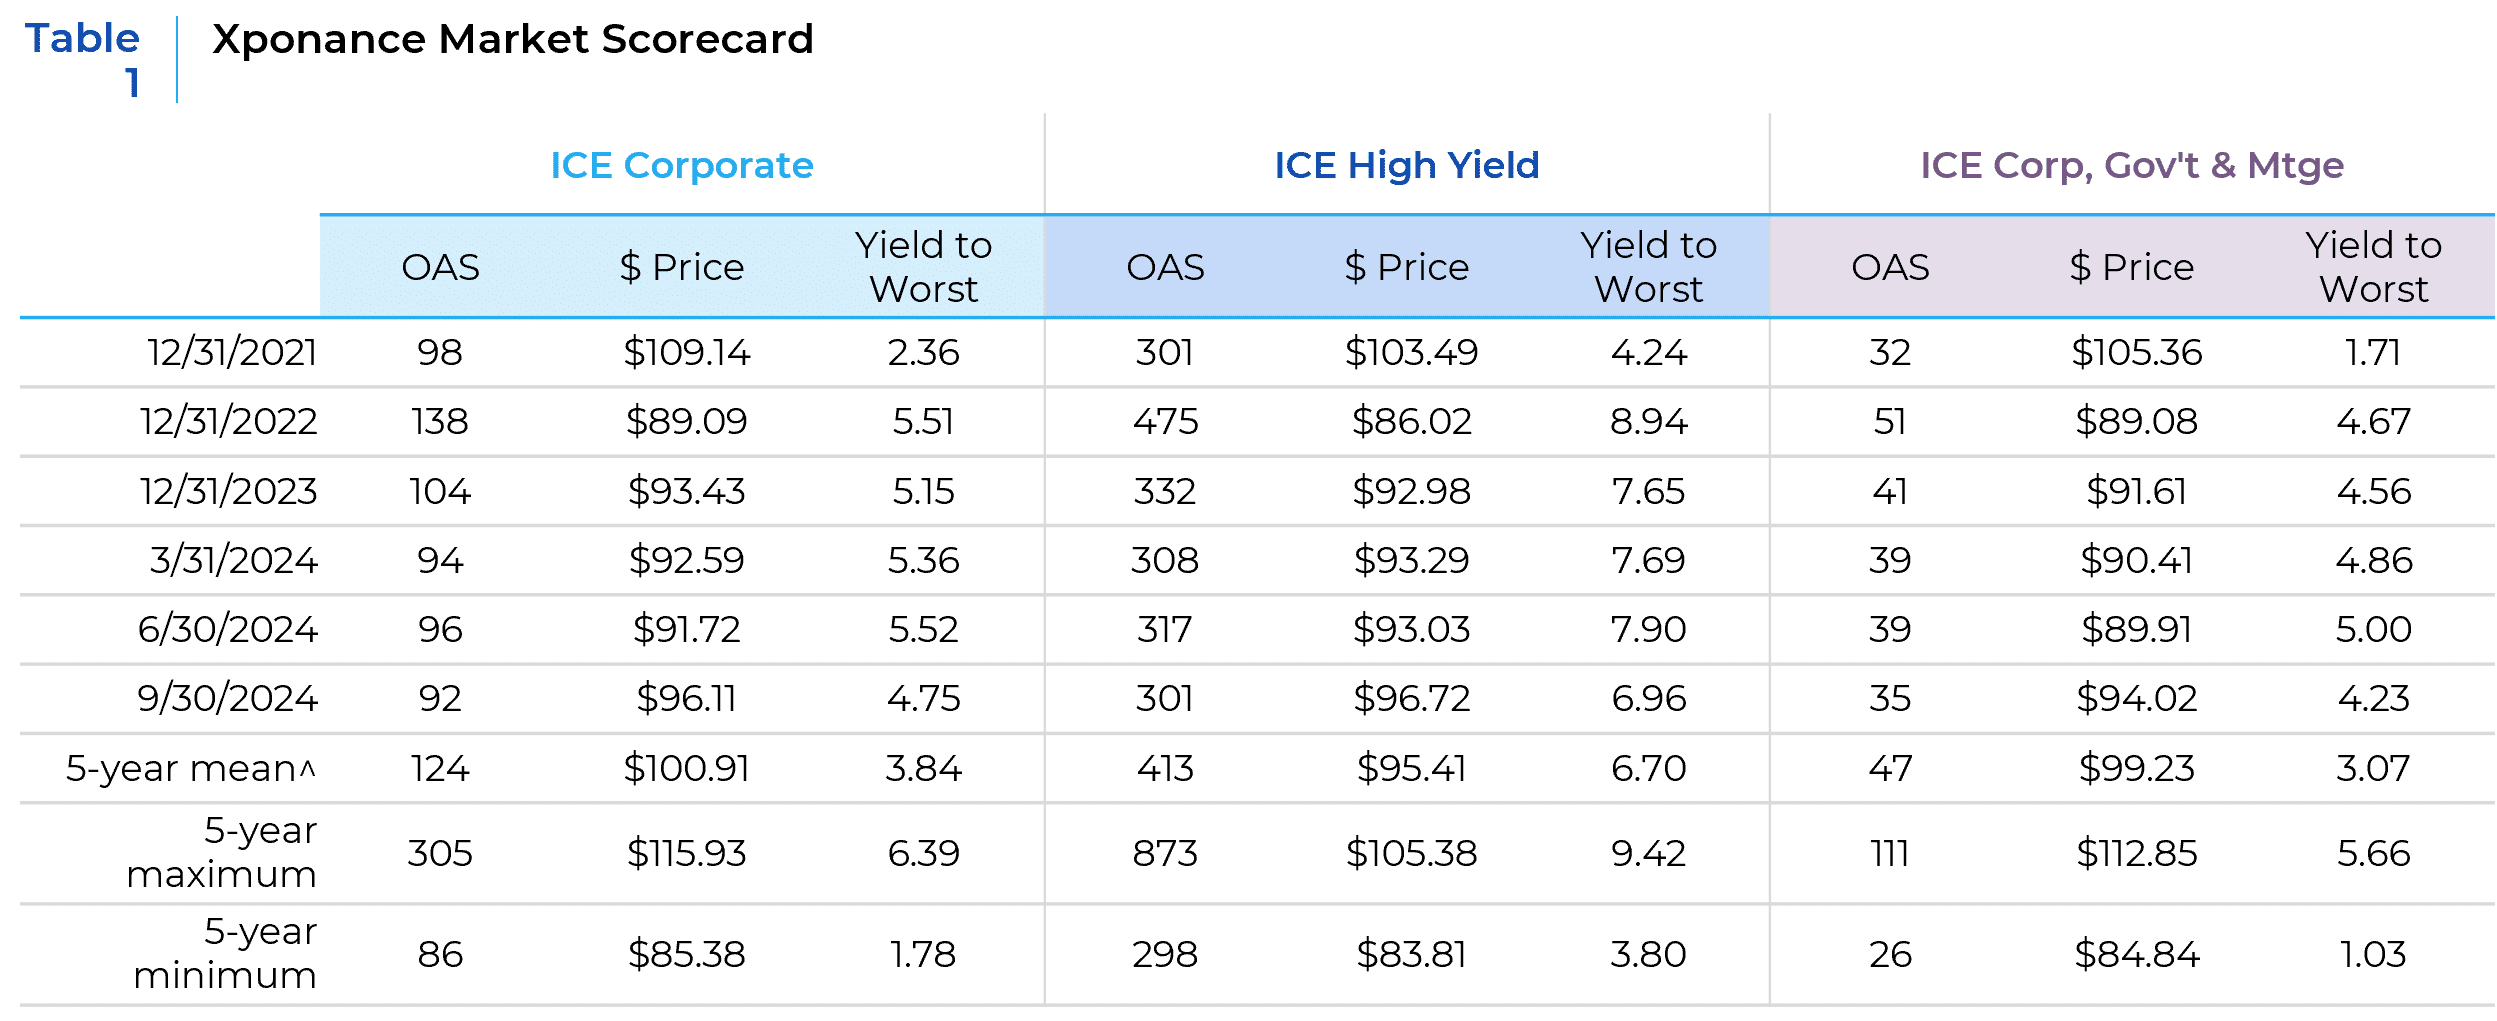
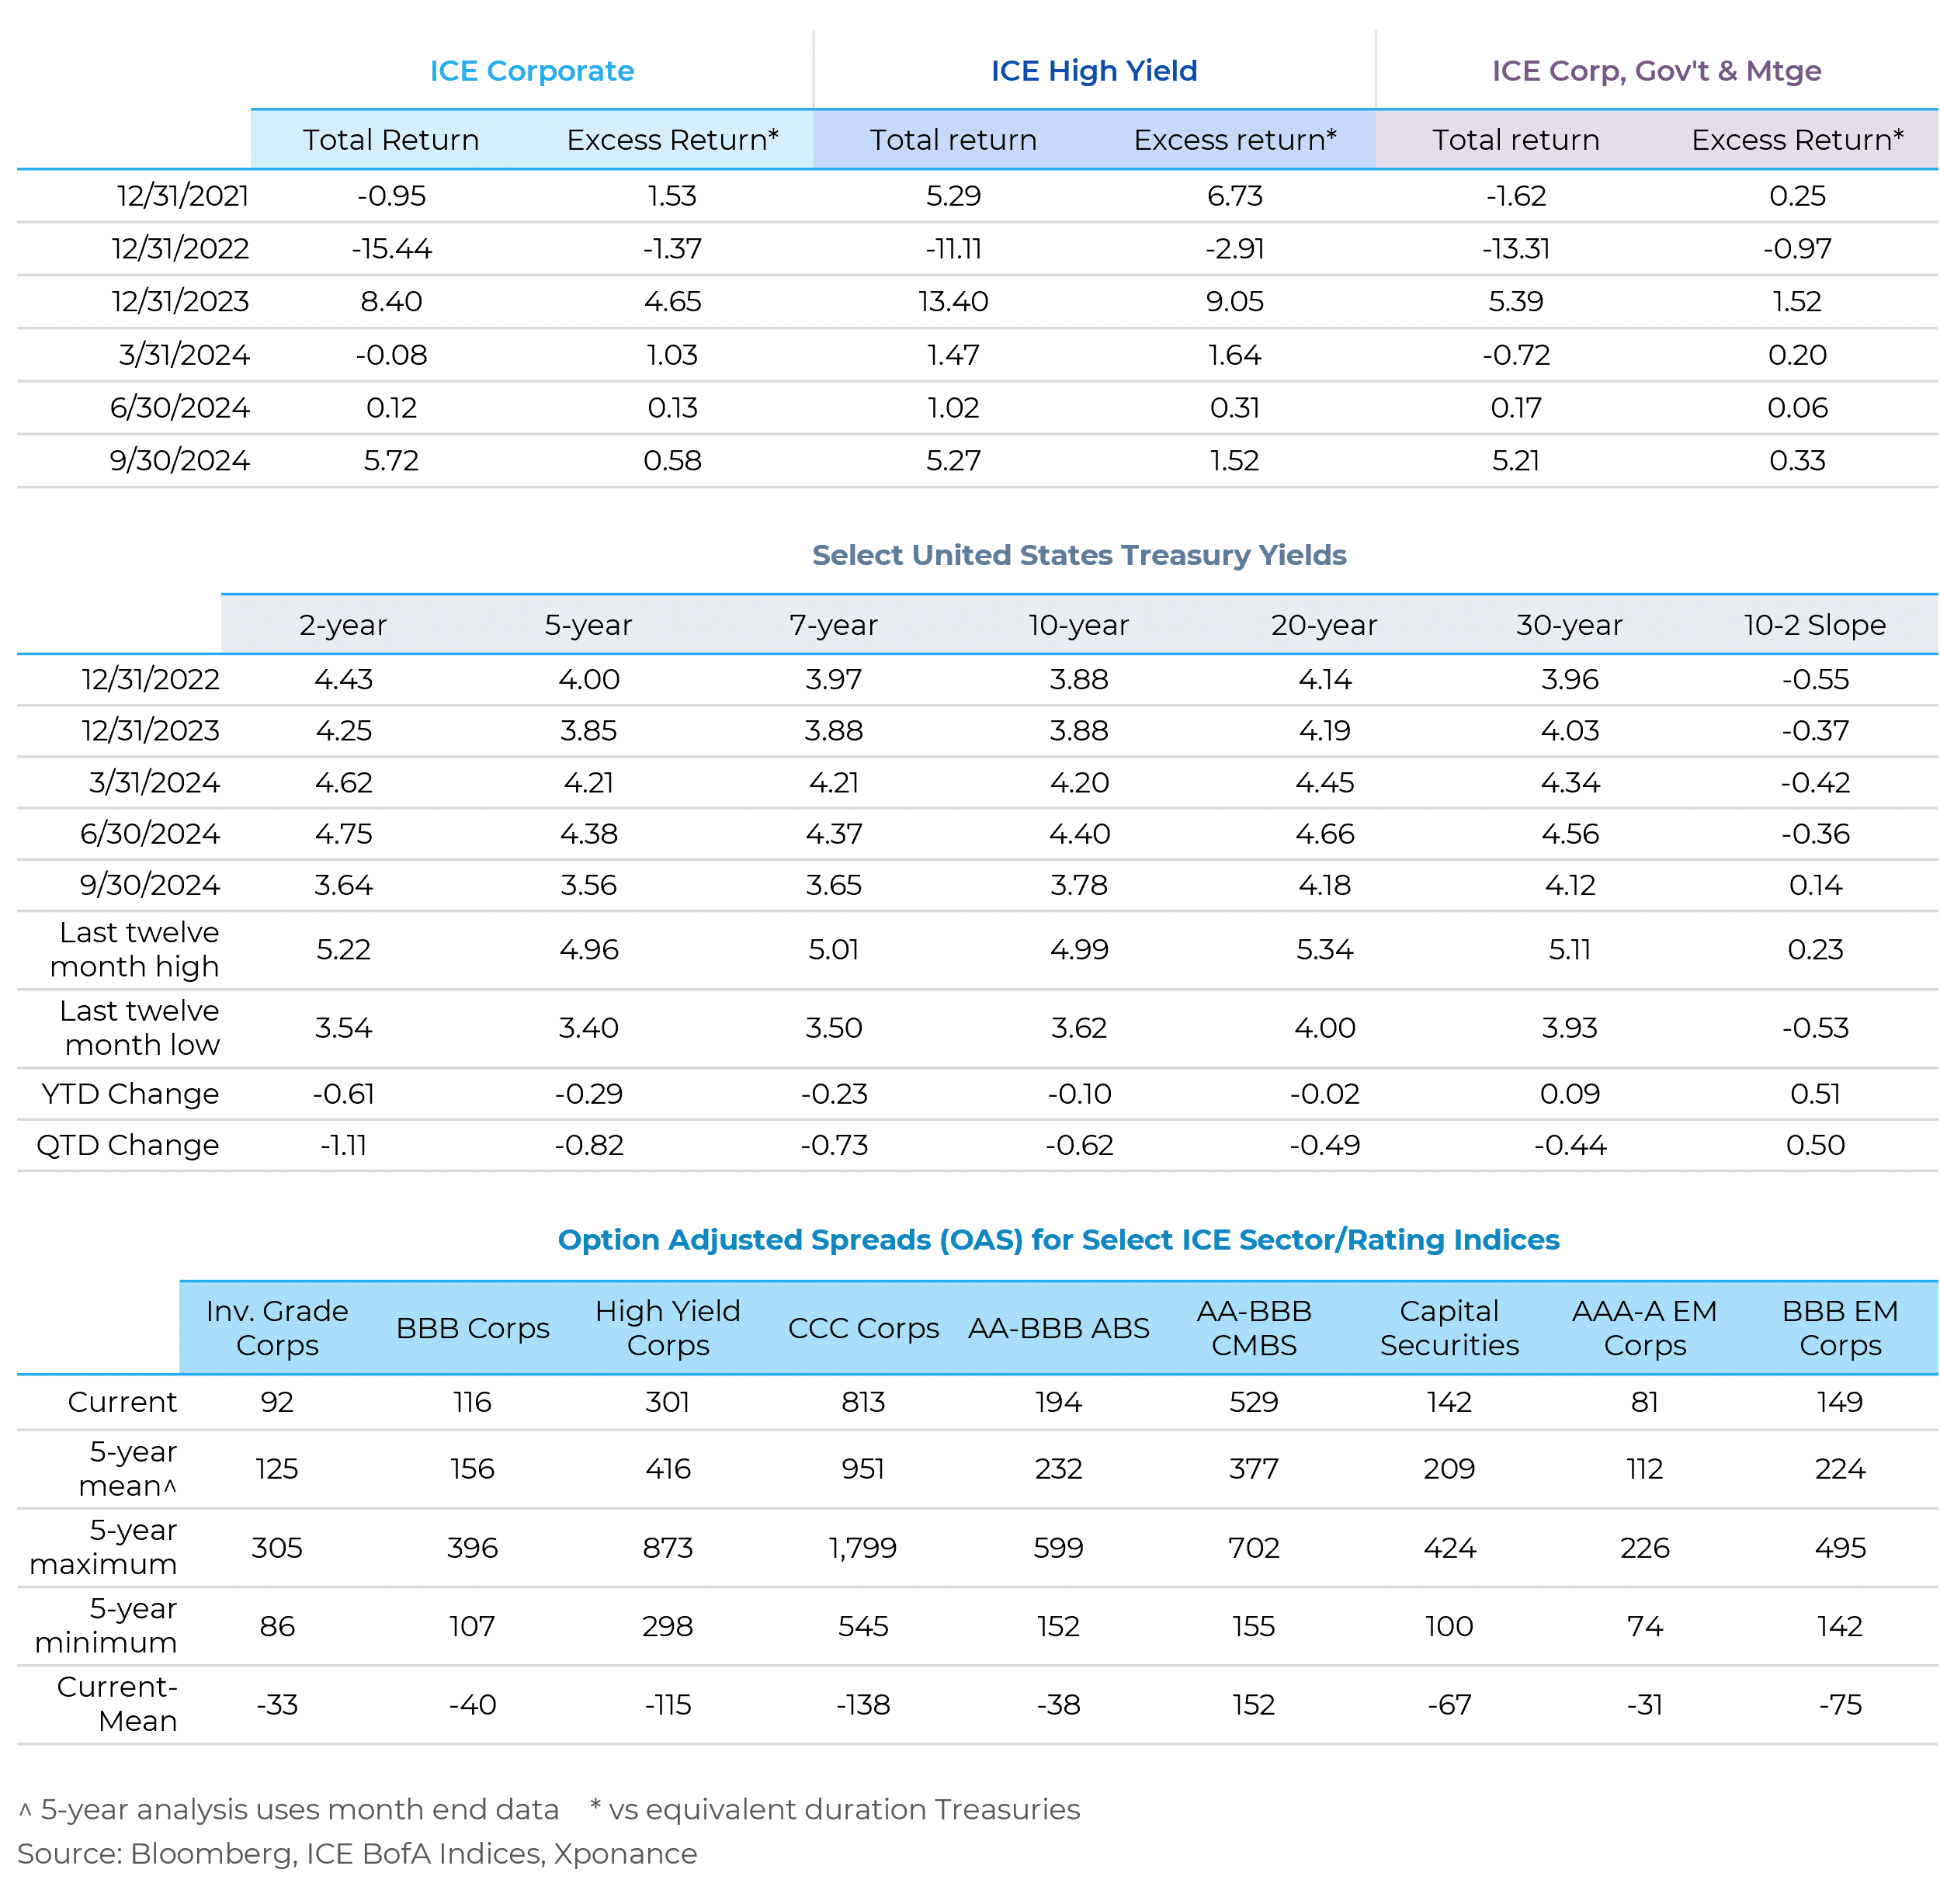
Aside from the Global Financial Crisis (GFC) period, only the onset of COVID-19 and the fourth quarter of 2023 are comparable in scope and magnitude to what happened in the bond market this quarter. The GFC and COVID-19 onset periods were marked by extremely hard landings for the US economy. In contrast, 4Q23 saw the market price in six or seven 25 basis points cuts in the FDTR, which forced the yield curve down in a similar fashion to what we witnessed this quarter.
We are struck by the contradiction in the narrative (both then and now) around a soft landing, coupled with market participants’ expectations of more than 150 basis points in further reductions to the FDTR. While the rate rally has moderated somewhat since the end of the quarter, expectations for further FDTR reductions remain in place.
Bloomberg survey data and coupon-implied forward rates are both currently forecasting only a modest increase in the slope of the United States Treasury yield curve during the expected period of monetary easing. Market expectations currently envision the Federal Funds Target Rate (FDTR) bottoming in the second quarter of 2026, at which point the 2s/10s slope is expected to peak at around 55 basis points.
However, history tells a different story about the shape and timing of the yield curve slope. The most recent inversion from the 2-year Treasury note to the 10-year Treasury note is well-documented as the longest in history, lasting 793 days from July 5, 2022, to September 5, 2024. As a leading indicator of recession, the average time from inversion to recession is twelve months over the past five decades. During this same period, the Global Financial Crisis (GFC) held the previous record for the longest period between inversion and recession.
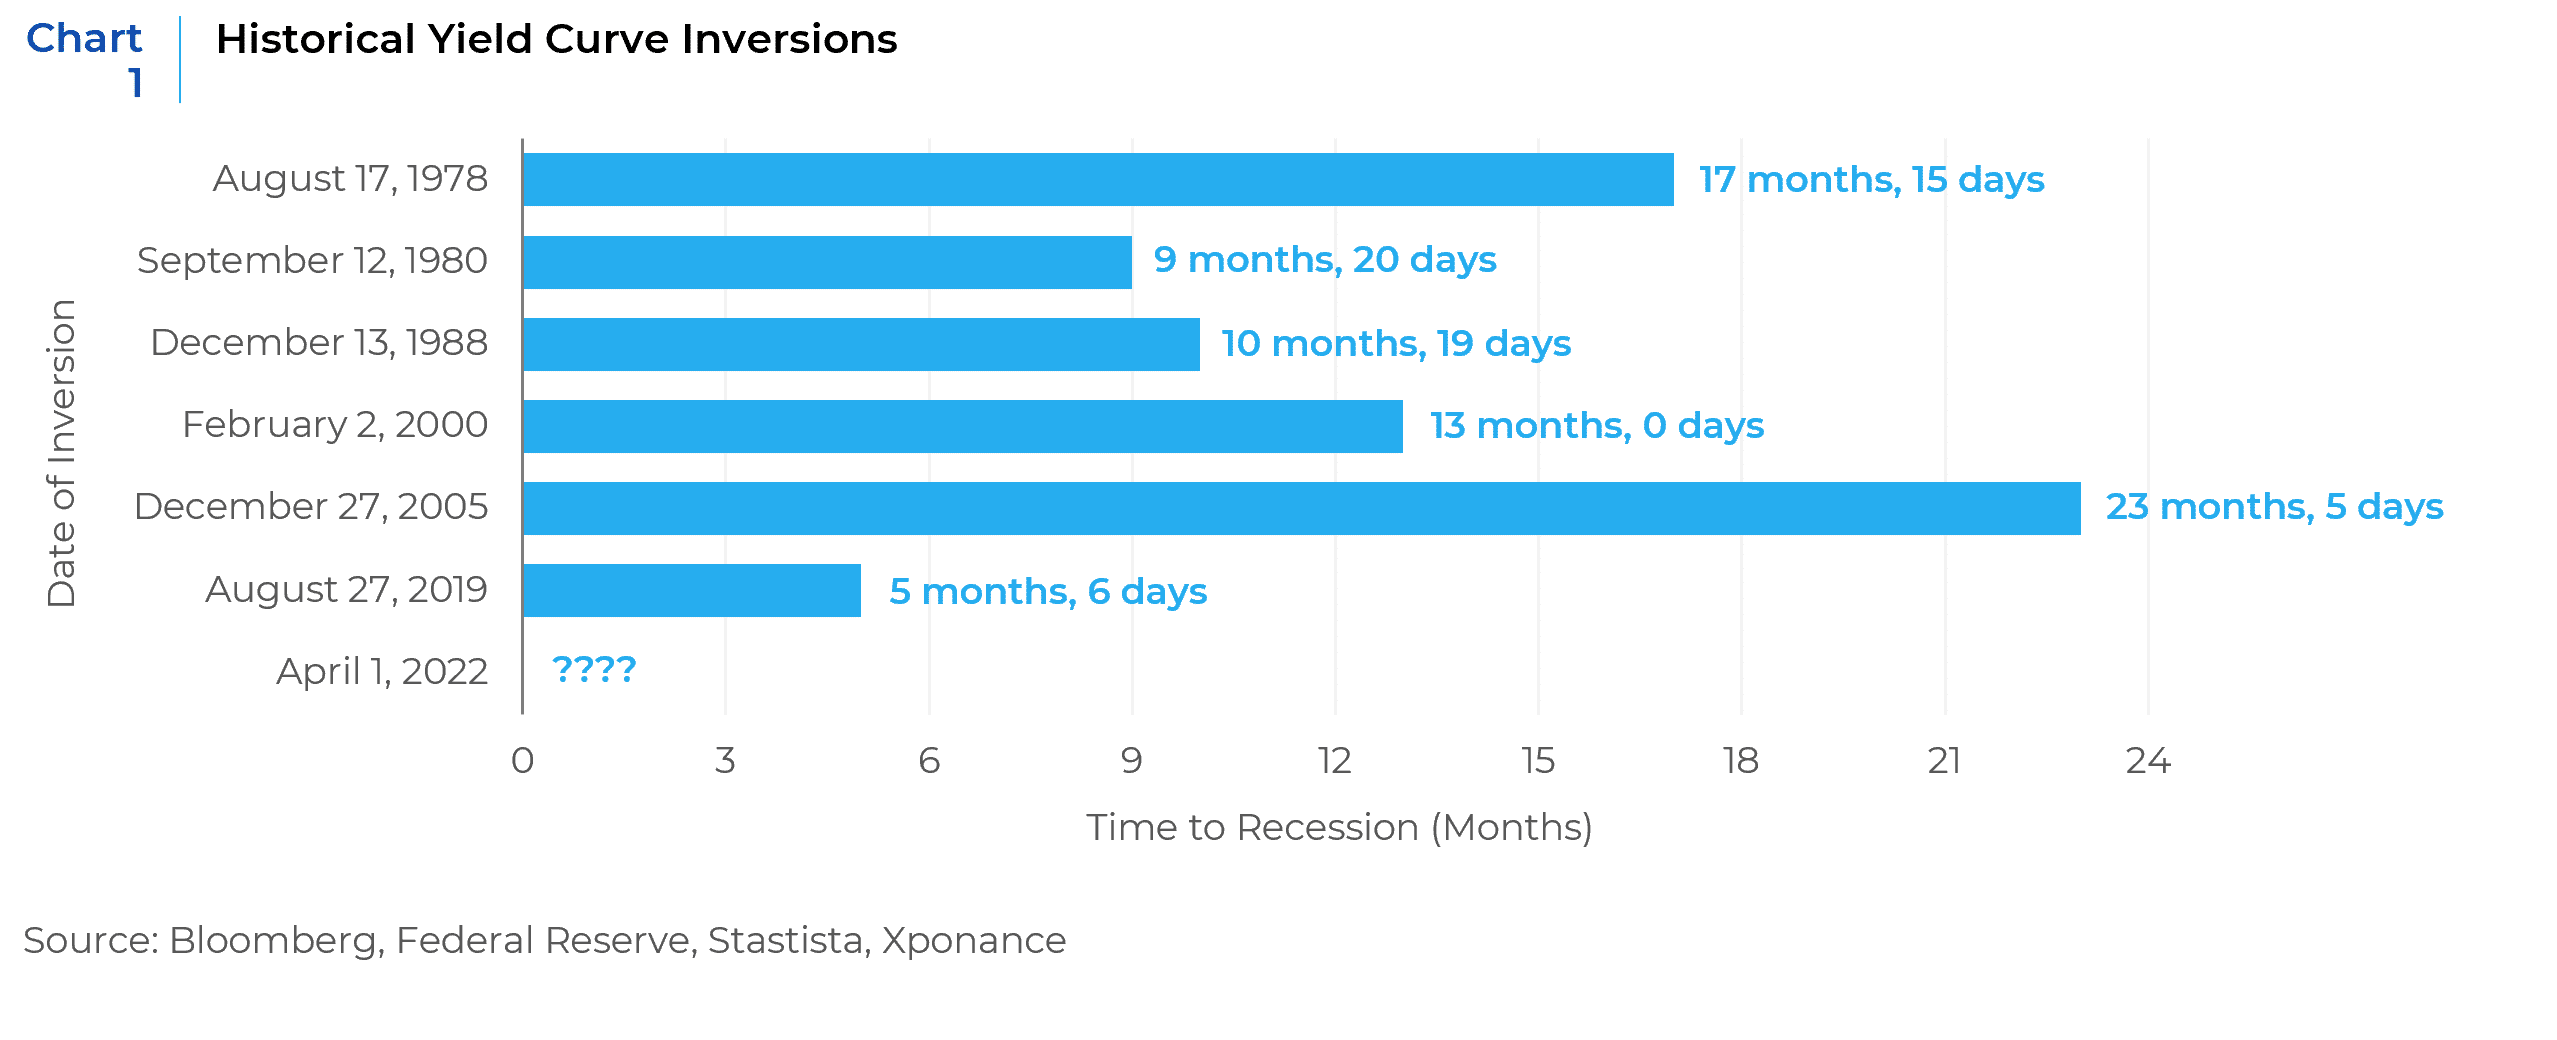
Historically, the curve begins to steepen ahead of what the National Bureau of Economic Research (NBER) eventually marks as the start of a recession. Interestingly, the curve also inverted briefly in August 2019, several months before the unforeseen three-month COVID-19 recession, and steepened thereafter, reaching a peak of 158 basis points one year later in March 2021.
When we look at statistical measures to put the curve shape into context, the long-term mean is 85 basis points with a standard deviation of 93 basis points. The curve is currently in the 23rd percentile of daily observations (the 25th percentile is 17 basis points, while the 75th percentile is 151 basis points). Clearly, a steepening curve ahead of a recession reflects expectations of looser monetary policy, with the lagged expectation of higher economic growth and/or higher inflation.
The current narrative around a “Goldilocks” scenario—continued above-trend growth with a coincident continued moderation in inflation—implies a flatter curve, as we see today. However, apart from the short-lived 1994-1995 tightening cycle, such a soft landing has never actually come to fruition. Every landing looks soft until the moment when a hard landing becomes imminent.
When examining risk premia in the credit markets, two primary concerns stand out. First, spreads remain tight despite weakening credit fundamentals (e.g., balance sheet and cash flow leverage, interest coverage, free cash flow) since the third quarter of 2021. With an option-adjusted spread (OAS) of 92 basis points at quarter-end, there is little room for further tightening in investment-grade corporates. The all-time tight over the past twenty years is 79 basis points for high-grade, a level reached in 2005 under very different sector compositions and significantly lower overall leverage.
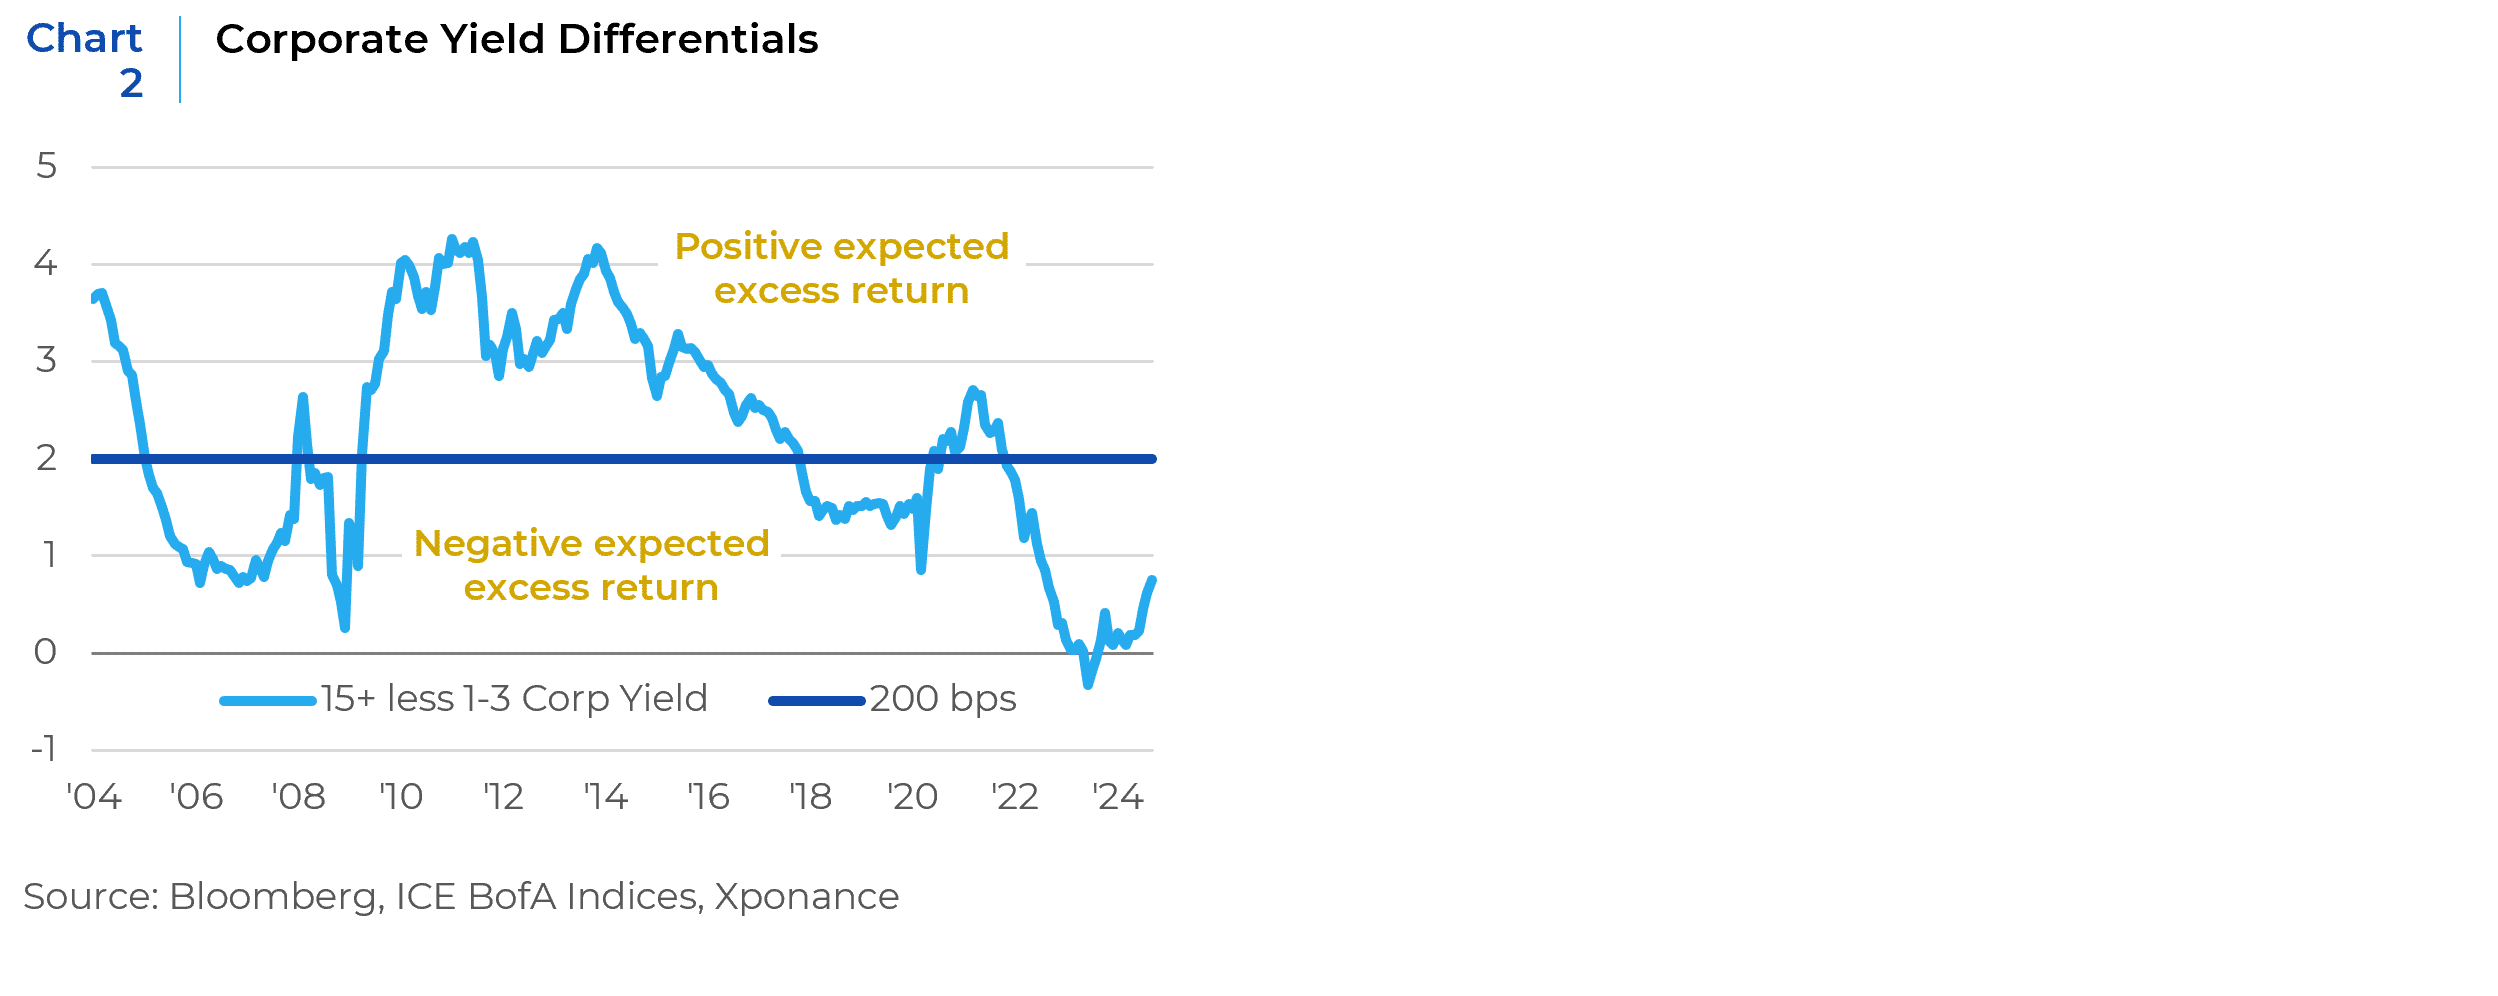
More important than absolute spread levels is the fact that credit curves are extremely flat. Coupled with the shape of the Treasury curve, this means investors are not adequately compensated for taking on risk in longer-dated credit instruments. Not only do spread curves look unattractive, but all-in corporate yields are historically unattractive relative to shorter-dated bonds. Yield per unit of duration is always unattractive for longer-dated bonds unless spreads are wide and capital appreciation is expected. With very little increase in absolute yield to extend into 15+ year credit from the belly of the maturity curve, investors are wise to avoid most long-end credit.
If the “Goldilocks” scenario does not materialize as markets currently expect, both the Treasury curve and corporate credit curves will steepen significantly. This would provide investment opportunities but also create meaningful negative total and excess returns. As a reminder, excess returns are simply the comparative return versus equivalent duration Treasuries, i.e., the risk-free asset at a given point along the yield curve.
For this analysis, we define credit yield curves as the difference between the yield on the 15+ year corporate index and the 1-3 year corporate index. When that difference is below 1 (i.e., one picks up less than 100 basis points to move from the front-end of the corporate maturity spectrum to the long-end), excess returns are, on average, meaningfully negative (negative 35 basis points over the past twenty years). Conversely, returns are meaningfully positive when the yield differential is above 2 (35 basis points of positive excess return on average). This is a variant of our typical yield breakeven analysis, where the yield advantage gained by moving into longer-dated corporates is not enough to compensate for potential downward price movement when spreads widen.
Despite the meager valuations on offer, there are still pockets of value in the fixed income markets. From a top-down perspective, valuations appear stretched for both investment-grade and high-yield corporates. However, by examining individual sector valuations, one can find compelling yields in sectors expected to have better downside protection than others.
We often discuss option-adjusted spread (OAS) dispersion among and between the sub-sectors of the corporate index, but we also monitor sub-sector valuations compared to their historical spread ranges. For example, if two different sectors have a current OAS of 100 basis points, but one has historically traded in a 200 basis-point range and the other in a 500 basis-point range, the latter is significantly overvalued by our sector beta methodology, indicating much greater potential downside at current valuations.
By this measure, there is some valuation differentiation remaining in the index, which provides swap ideas that allow our portfolios to remain reasonably defensive while still taking advantage of the higher all-in yields available in the marketplace.
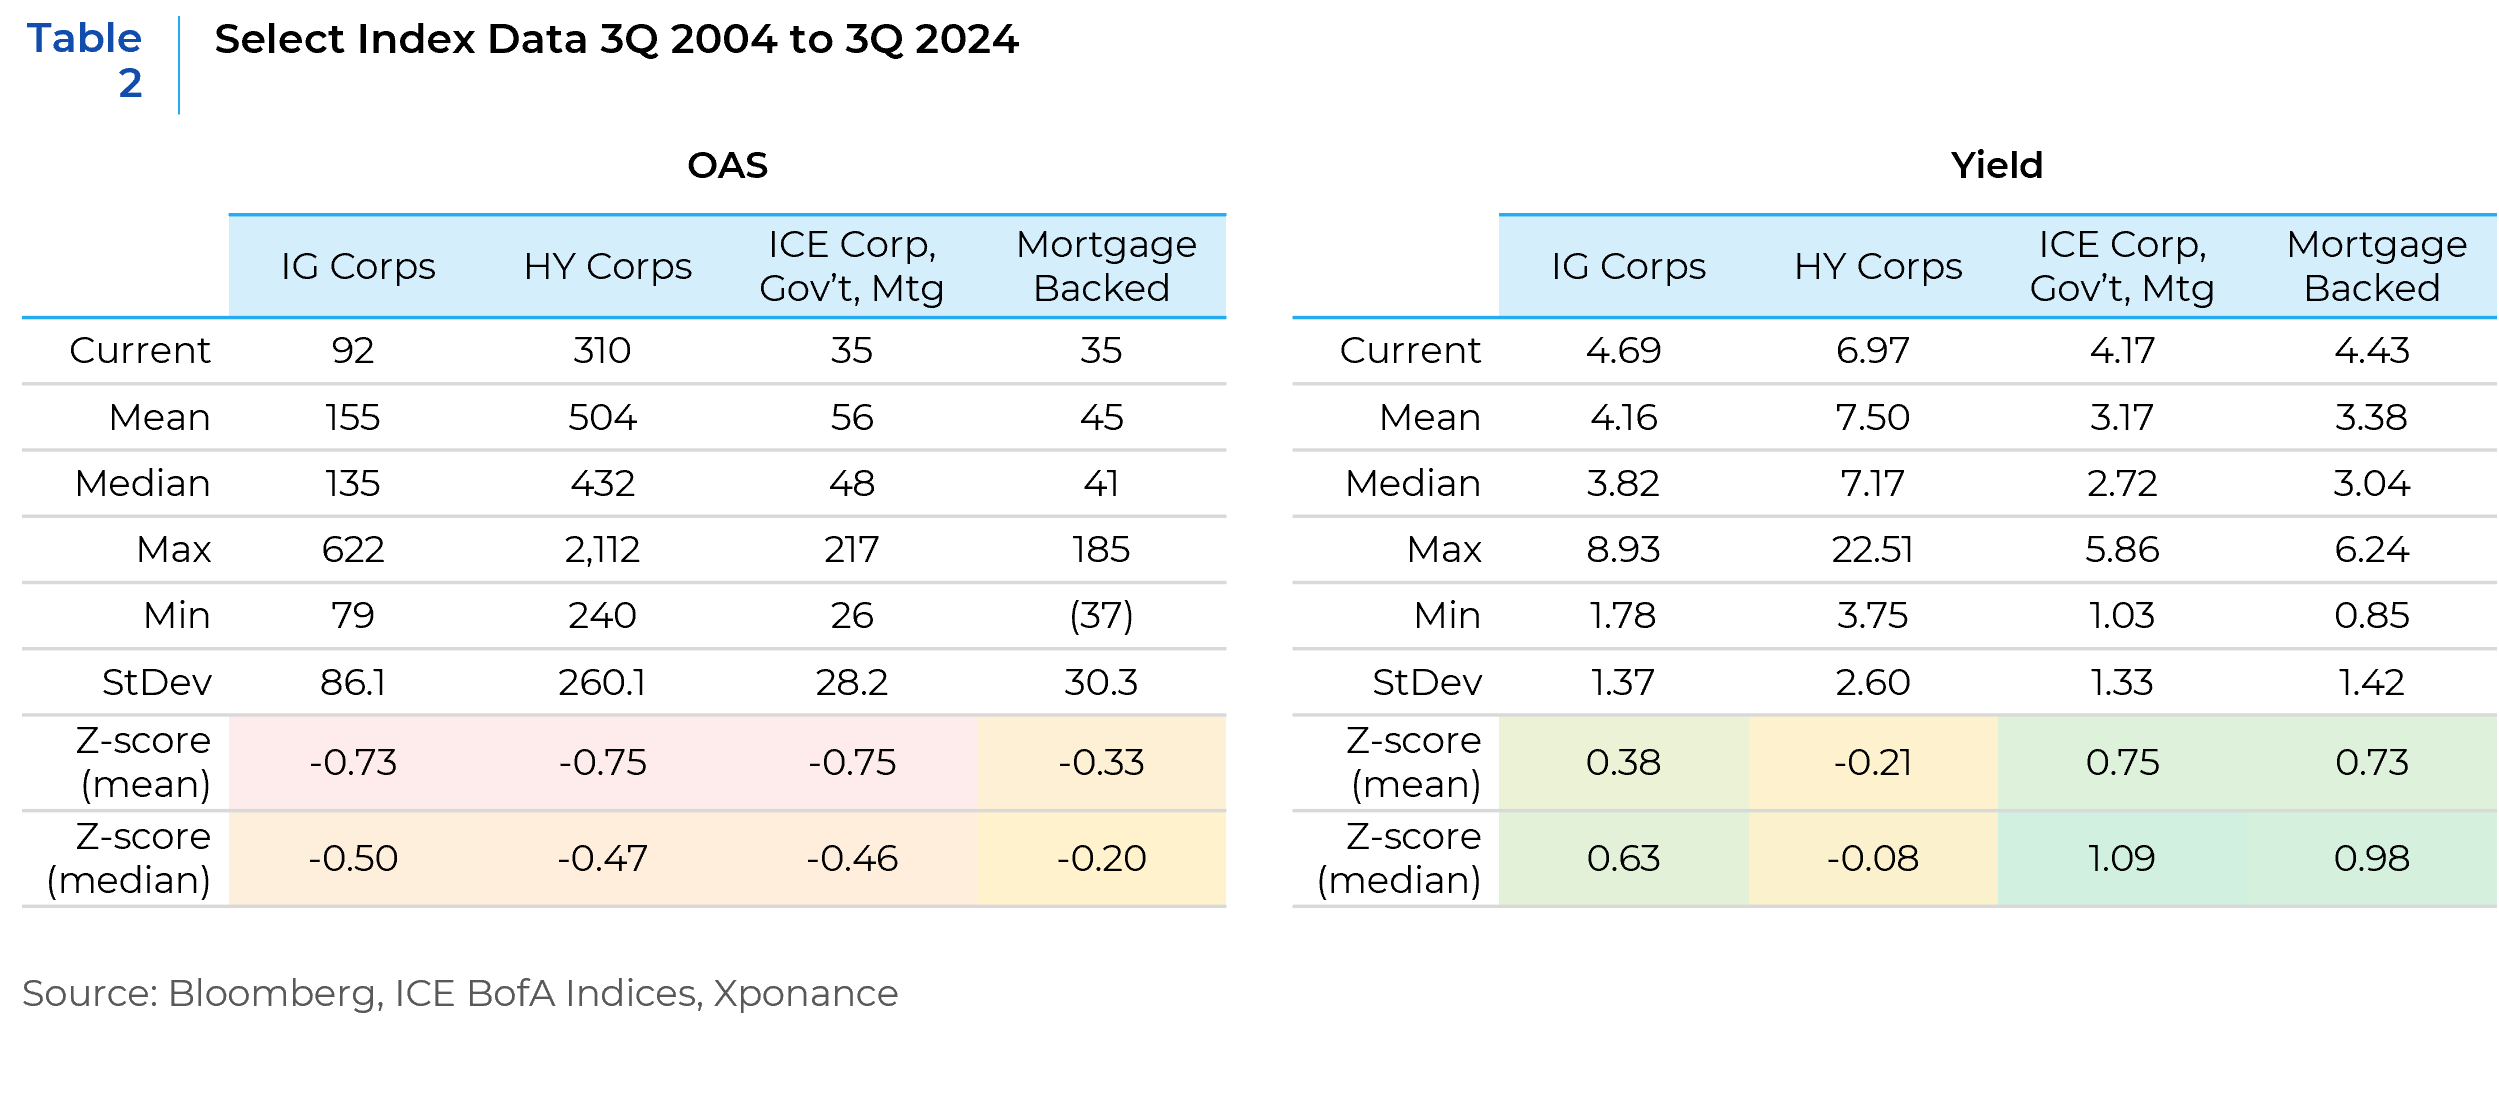
What does all this mean in terms of outlook and portfolio positioning? As noted above, spreads are not historically attractive, currently sitting nearly three-quarters of a standard deviation inside the twenty-year mean for investment grade, high yield, and broad market indices. However, yields appear much more attractive historically, with z-scores wide of the historical mean for the broad investment-grade components of the core indices.
High yield is unattractive on both measures, but investment-grade corporates and agency mortgage-backed securities (MBS) present selective opportunities. MBS is broadly attractive for several reasons, including current dollar prices relative to the makeup of the underlying securities within the index. The MBS index is largely composed of 2% and 2.5% coupons, but virtually the entire coupon stack remains at a discounted dollar price, allowing for differentiated exposure compared to the index while taking a different approach to prepayment accretion versus current income. Additionally, certain corporate sectors offer unique thematic investment opportunities as a value proposition using the sector beta methodology discussed above. We can maintain above-index yield in the corporate portfolio while doing so in sectors that have lower spread downside.
This report is neither an offer to sell nor a solicitation to invest in any product offered by Xponance® and should not be considered as investment advice. This report was prepared for clients and prospective clients of Xponance® and is intended to be used solely by such clients and prospective clients for educational and illustrative purposes. The information contained herein is proprietary to Xponance® and may not be duplicated or used for any purpose other than the educational purpose for which it has been provided. Any unauthorized use, duplication or disclosure of this report is strictly prohibited.
This report is based on information believed to be correct but is subject to revision. Although the information provided herein has been obtained from sources which Xponance® believes to be reliable, Xponance® does not guarantee its accuracy, and such information may be incomplete or condensed. Additional information is available from Xponance® upon request. All performance and other projections are historical and do not guarantee future performance. No assurance can be given that any particular investment objective or strategy will be achieved at a given time and actual investment results may vary over any given time.

